Fig. 6
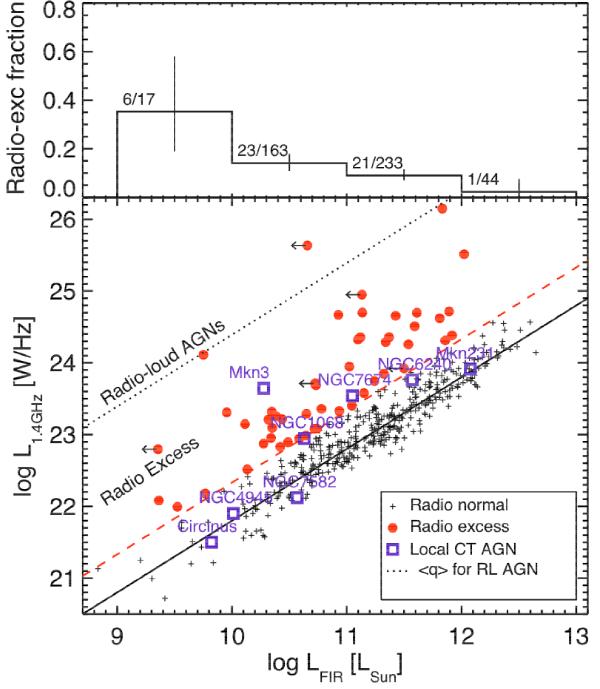
Top panel: fraction of radio-excess sources as a function of the rest-frame FIR luminosity (42.5–122.5 μm, in units of L⊙); the fraction decreases with increasing LFIR, as expected since sources with high LFIR are more likely to be luminous star-forming galaxies. Bottom panel: rest-frame FIR vs. radio 1.4 GHz luminosity (rest-frame); the radio-excess sources are plotted as red circles and some local well known Compton-thick AGNs (open squares) are shown for comparison (data taken from literature). The black dotted line correspond to ⟨ qRL⟩ = −0.38 (average for a sample of RL AGN from Evans et al. 2005); the black solid line correspond to q = 2.21 (average for “radio-normal” sources) and the red dashed line correspond to q = 1.68, our selection limit for radio-excess sources.
Current usage metrics show cumulative count of Article Views (full-text article views including HTML views, PDF and ePub downloads, according to the available data) and Abstracts Views on Vision4Press platform.
Data correspond to usage on the plateform after 2015. The current usage metrics is available 48-96 hours after online publication and is updated daily on week days.
Initial download of the metrics may take a while.