Fig. 5
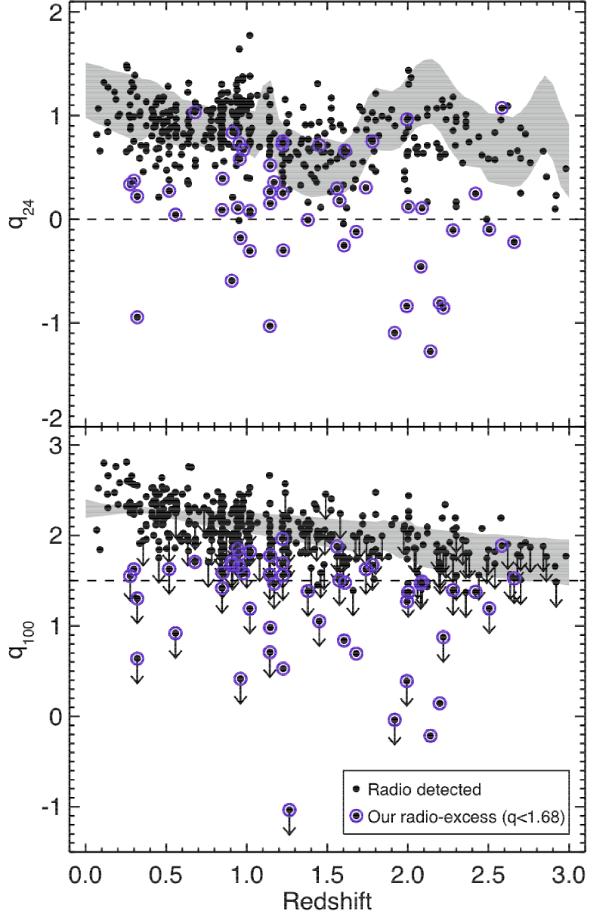
Infrared-to-radio flux ratios, using the observed 24 μm (q24; top) and 100 μm flux densities (q100; bottom); the radio-excess sources in our sample (q < 1.68) are highlighted by open circles. The shaded regions in the two plots represent the q24 and q100 ratios predicted for our range of star-forming galaxies as a function of redshift. The horizontal line in the top plot is the q24 = 0 selection used by Donley et al. (2005) to define their radio-excess sample. In the bottom panel we identified q100 = 1.5 as an easy selection of radio-excess sources (dashed line), with reasonable completeness (≈60–80%) at least out to z ≈ 2.
Current usage metrics show cumulative count of Article Views (full-text article views including HTML views, PDF and ePub downloads, according to the available data) and Abstracts Views on Vision4Press platform.
Data correspond to usage on the plateform after 2015. The current usage metrics is available 48-96 hours after online publication and is updated daily on week days.
Initial download of the metrics may take a while.