Fig. 4
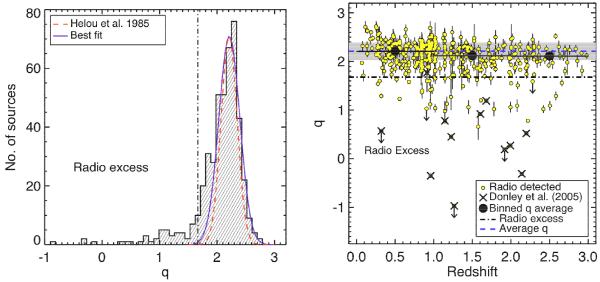
Left: distribution of FIR-radio flux ratio (q) for all of the sources in the VLA/24 μm sample (458 sources, excluding the upper limits; see Sect. 3.2); the blue Gaussian profile represents the best fit to the peak (qmean = 2.21 ± 0.18), while the red dashed Gaussian is the q distribution found by Helou et al. (1985) for local starburst galaxies. The vertical line indicates the separation we assumed to select our radio-excess sources, q = 1.68, corresponding to 3σ from the peak (2σ when include radio upper limits). Right: FIR-radio flux ratio (q) as a function of redshift for all of the VLA/24 μm sources; the radio-excess sources have q < 1.68 (dot-dashed line); the solid horizontal line represents the average q value for the “radio-normal” sources (q = 2.21) and the shaded region indicates the ± 1σ error from this average. The radio-excess sources identified by Donley et al. (2005) are plotted as crosses (see Sect. 3.3). The binned q average for the “radio-normal” sources, in three redshift bins, is also shown as black circles; we found no significant evidence of evolution of the FIR-radio correlation out to z = 3.
Current usage metrics show cumulative count of Article Views (full-text article views including HTML views, PDF and ePub downloads, according to the available data) and Abstracts Views on Vision4Press platform.
Data correspond to usage on the plateform after 2015. The current usage metrics is available 48-96 hours after online publication and is updated daily on week days.
Initial download of the metrics may take a while.