Fig. 3
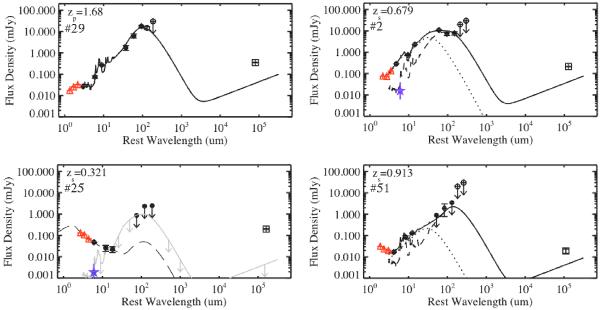
Examples of spectral energy distributions (SEDs) to demonstrate the variety of SEDs found for the radio-excess sources (Sect. 3.2). The SEDs on the left are consistent with a simple galaxy template: SFG template (“IR SFG”, top) or elliptical galaxy template (“passive”, bottom; see Sect. 4.3); the SFG template upper limit (grey line) is also shown. We note that the elliptical template (long dashed line) is not fitted to the data, but it is only shown to demonstrate that it can well represent the data. The SEDs on the right are fitted with a star-forming galaxy (dashed line) + AGN (dotted line) model (“IR AGN”): on the top there is an X-ray detected AGN, on the bottom an X-ray undetected AGN. The total SEDs are shown as black solid lines. The filled circles represent the Spitzer 8, 16, 24 μm and the Herschel 100, 160, 250 μm flux densities (in mJy), used to constrain the SEDs. The open symbols indicates the data that were not included in the SED fitting process: red triangles are Spitzer-IRAC 3.6, 4.5, 5.8 μm flux densities, black circles are SPIRE 350 and 500 μm and black squares are VLA 1.4 GHz flux densities; the radio data do not match the SEDs in these cases, because the sources have excess radio emission compared to that expected from pure star formation (Sect. 3.2). The blue star represents the 6 μm luminosity of the AGN predicted from the X-ray luminosity in the rest-frame 2–10 keV, using the Lutz et al. (2004) relation for local unobscured AGN; we note that this point does not match the IR AGN component because the X-ray luminosity tends to underestimate the intrinsic AGN power if the AGN emission is heavily absorbed (see Sect. 5.1). On the top left corner of each plot the source redshifts are indicated as well as the corresponding source number in Table 1 (Col. 1).
Current usage metrics show cumulative count of Article Views (full-text article views including HTML views, PDF and ePub downloads, according to the available data) and Abstracts Views on Vision4Press platform.
Data correspond to usage on the plateform after 2015. The current usage metrics is available 48-96 hours after online publication and is updated daily on week days.
Initial download of the metrics may take a while.