Fig. B.1
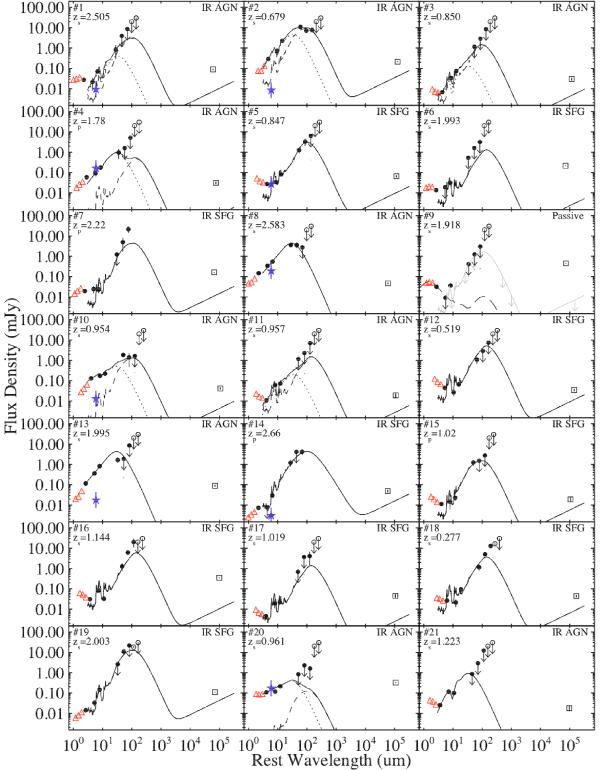
Best-fit SEDs for the 51 sources in the radio-excess sample. The total SEDs are shown as black solid lines, the AGN templates are shown as dotted lines and the SFG templates as dashed lines. Filled circles represent the Spitzer 8, 16, 24 μm and the Herschel 100, 160, 250 μm flux densities, which are used to constrain the SEDs. Open symbols indicate the data that were not included in the SED fitting process: red triangles are Spitzer-IRAC 3.6, 4.5, 5.8 μm flux densities, black open circles are SPIRE 350 and 500 μm, and black squares are VLA 1.4 GHz flux densities; the blue stars represent the 6 μm luminosity of the AGN predicted from the X-ray luminosity (2–10 keV, rest-frame) using the Lutz et al. (2004) relation for local unobscured AGN; we note that these points do not always match the IR AGN component because the X-ray luminosity tends to underestimate the intrinsic AGN power if the AGN emission is heavily absorbed. For the passive sources we plotted the SFG template upper limit (grey line) and an elliptical galaxy template (long dashed line; Sect. 4.3) to show that it could well represent the data, although we stress that this latter template is not included in our SED fitting analysis. The rise of the IRAC data point at short wavelengths observed for many sources is due to the emission from the galaxy old stellar population.
Current usage metrics show cumulative count of Article Views (full-text article views including HTML views, PDF and ePub downloads, according to the available data) and Abstracts Views on Vision4Press platform.
Data correspond to usage on the plateform after 2015. The current usage metrics is available 48-96 hours after online publication and is updated daily on week days.
Initial download of the metrics may take a while.