Fig. A.2
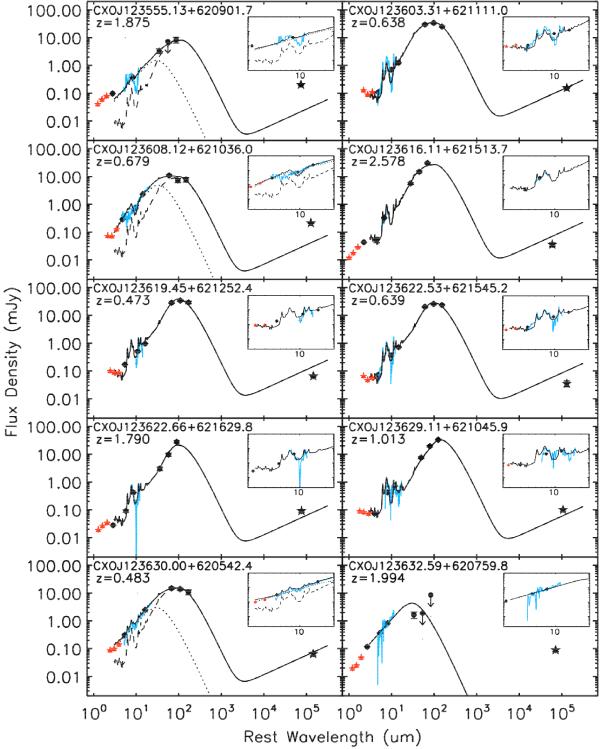
Best-fitting solutions to the spectral energy distributions (SEDs) of the X-ray detected sources in GOODS-N with Spitzer-IRS spectroscopy (Kirkpatrick et al. 2012; Murphy et al. 2009; Pope et al. 2008). The dotted lines represent the AGN component and the dashed lines indicate the SFG component; the total SEDs are represented as solid lines. The Spitzer 8, 16, 24 μm and the Herschel 100, 160, 250 μm data points (black circles) have been used to constrain the SEDs, while the Spitzer-IRAC 3.6, 4.5, 5.8 μm (red stars) and the VLA 1.4 GHz (black star) radio data points are over plotted on the SEDs but they are not included in the fit. The Spitzer-IRS spectrum is also shown (cyan line), but it is NOT used to constrain the SEDs. On the top right-hand side of each plot, a zoom on the Spitzer-IRS spectrum is shown (2.5–25 μm); our best-fit SEDs are typically in very good agreement with the Spitzer-IRS spectra.
Current usage metrics show cumulative count of Article Views (full-text article views including HTML views, PDF and ePub downloads, according to the available data) and Abstracts Views on Vision4Press platform.
Data correspond to usage on the plateform after 2015. The current usage metrics is available 48-96 hours after online publication and is updated daily on week days.
Initial download of the metrics may take a while.