Fig. A.1
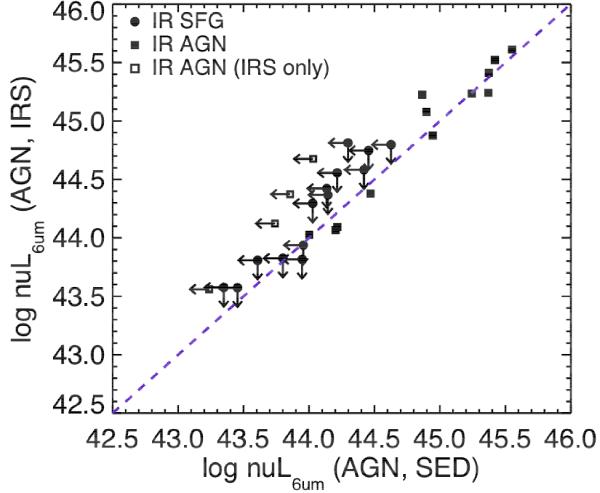
Comparison of the AGN 6 μm luminosity obtained from the SED fitting of the photometric Spitzer and Herschel data points (νL6 μm, SED) versus the L6 μm estimated from the IRS spectral (+ Herschel data points) fitting (νL6 μm, IRS). For the IR SFGs, where the AGN component was not significantly detected, we plotted an upper limit of the AGN L6 μm (i.e., 30% of the total 6 μm luminosity; see Appendix A). Sources where the classification from the two analyses agree are shown as filled symbols: IR AGN (filled squares) and IR SFG (filled circles). The AGN identified only from the IRS spectral fit are shown as open squares.
Current usage metrics show cumulative count of Article Views (full-text article views including HTML views, PDF and ePub downloads, according to the available data) and Abstracts Views on Vision4Press platform.
Data correspond to usage on the plateform after 2015. The current usage metrics is available 48-96 hours after online publication and is updated daily on week days.
Initial download of the metrics may take a while.