Fig. 9
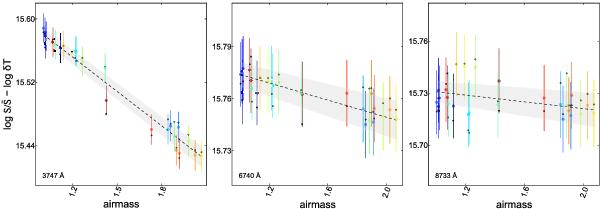
Linear fit of  with respect to the airmass for
three different wavelengths (indicated by dashed lines in the top
panel), where each point represents a star with (large points with error
bars) or without (small points) grey extinction correction. The dashed lines
represent the linear fits and the grey bands their corresponding error.
with respect to the airmass for
three different wavelengths (indicated by dashed lines in the top
panel), where each point represents a star with (large points with error
bars) or without (small points) grey extinction correction. The dashed lines
represent the linear fits and the grey bands their corresponding error.
Current usage metrics show cumulative count of Article Views (full-text article views including HTML views, PDF and ePub downloads, according to the available data) and Abstracts Views on Vision4Press platform.
Data correspond to usage on the plateform after 2015. The current usage metrics is available 48-96 hours after online publication and is updated daily on week days.
Initial download of the metrics may take a while.