Fig. 21
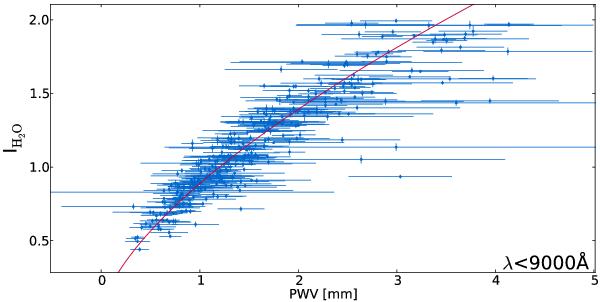
Correlation between the intensity of the water telluric line computed from the SNfactory data and the Precipitable Water Vapor gathered from the Caltech Submillimeter Observatory. The red line represents the best power law fit of the distribution with an exponent value of 0.62 – close to the water saturation parameter of 0.6 used in our procedure.
Current usage metrics show cumulative count of Article Views (full-text article views including HTML views, PDF and ePub downloads, according to the available data) and Abstracts Views on Vision4Press platform.
Data correspond to usage on the plateform after 2015. The current usage metrics is available 48-96 hours after online publication and is updated daily on week days.
Initial download of the metrics may take a while.