Free Access
Fig. 15
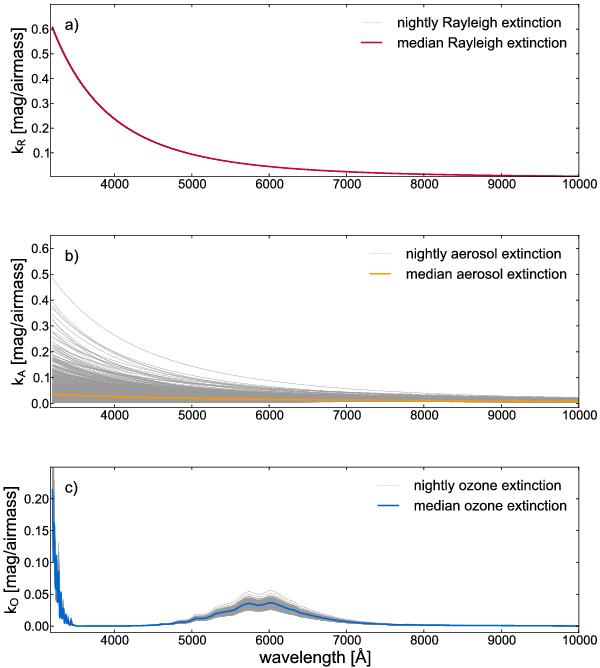
Nightly contributions of each physical component of the continuum extinction, showing their mean value and variability during the course of our observing campaign. All the nightly Rayleigh extinction curves (in grey) are within the width of the red median curve.
Current usage metrics show cumulative count of Article Views (full-text article views including HTML views, PDF and ePub downloads, according to the available data) and Abstracts Views on Vision4Press platform.
Data correspond to usage on the plateform after 2015. The current usage metrics is available 48-96 hours after online publication and is updated daily on week days.
Initial download of the metrics may take a while.