Fig. 9
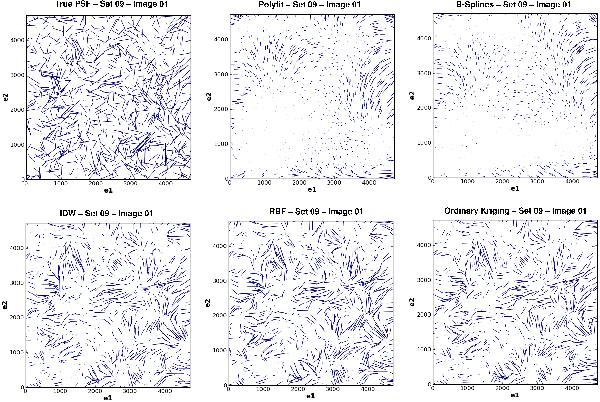
An illustration of how the various interpolation methods studied in this article handled a turbulent PSF, which in this case is the first image of set 9. The true ellipticities are plotted on the upper-left corner of the figure and the remaining plots show the predictions of each methods. The largest whisker in the upper-left corner plot corresponds to an ellipticity of 0.38.
Current usage metrics show cumulative count of Article Views (full-text article views including HTML views, PDF and ePub downloads, according to the available data) and Abstracts Views on Vision4Press platform.
Data correspond to usage on the plateform after 2015. The current usage metrics is available 48-96 hours after online publication and is updated daily on week days.
Initial download of the metrics may take a while.