Free Access
Fig. 8
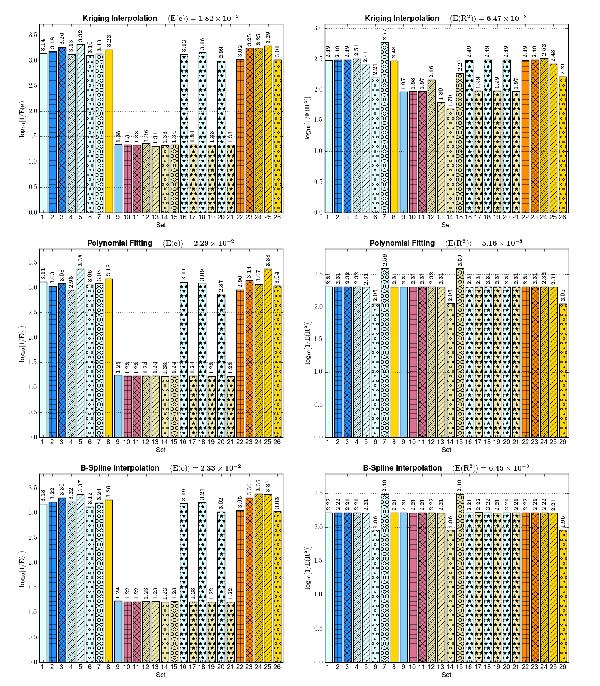
Accuracy per set for Kriging, polynomial fitting and B-splines. The legend is the same as that used in Fig. 7. The values on the bars correspond to log 10(1/E(e)) and log 10(1/E(R2)) depending on the quantity plotted, so the taller the bar the greater the corresponding accuracy.
Current usage metrics show cumulative count of Article Views (full-text article views including HTML views, PDF and ePub downloads, according to the available data) and Abstracts Views on Vision4Press platform.
Data correspond to usage on the plateform after 2015. The current usage metrics is available 48-96 hours after online publication and is updated daily on week days.
Initial download of the metrics may take a while.