Fig. 6
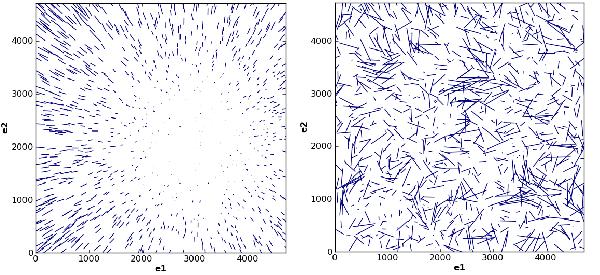
A Star Challenge non-turbulent PSF (left) compared with a turbulent PSF (right). Each “whisker” represents the amplitude |e| of the ellipticity of stars. The largest whisker in the left hand side image corresponds to an ellipticity of 0.16. The right hand side image has a maximum ellipticity of 0.37. The ellipticity plots have respectively been made from the first PSF field image of sets 8 and 14.
Current usage metrics show cumulative count of Article Views (full-text article views including HTML views, PDF and ePub downloads, according to the available data) and Abstracts Views on Vision4Press platform.
Data correspond to usage on the plateform after 2015. The current usage metrics is available 48-96 hours after online publication and is updated daily on week days.
Initial download of the metrics may take a while.