Fig. 3
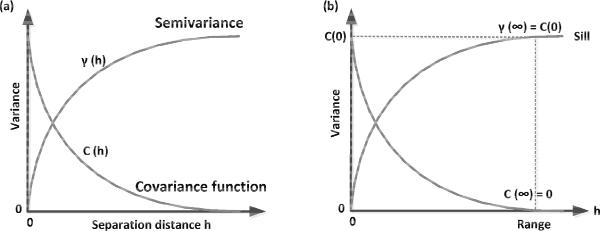
a) Typical variogram γ(h) and its equivalent covariance function C(h): if the data has some sort of spatial autocorrelation, nearby (small h) Z(x) observed values will be more similar than more distant Z(x) values (larger h); b) as the separation distance h grows, the quantity Z(x + h) − Z(x) in expression (16) will tend to increase on average, but less and less as the influence of Z(h) on Z(x + h) weakens; at some threshold distance h, called the range, the increase in variance becomes negligible and the asymptotical variance value is known as the sill
Current usage metrics show cumulative count of Article Views (full-text article views including HTML views, PDF and ePub downloads, according to the available data) and Abstracts Views on Vision4Press platform.
Data correspond to usage on the plateform after 2015. The current usage metrics is available 48-96 hours after online publication and is updated daily on week days.
Initial download of the metrics may take a while.