Fig. C.1
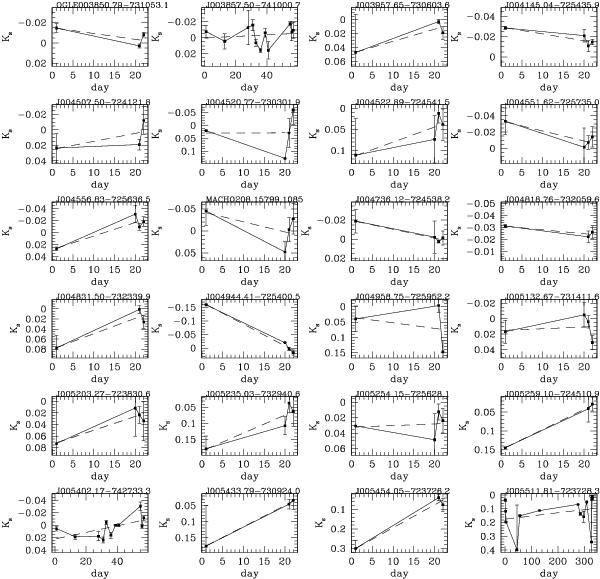
Ks band light-curves of known QSOs with respect to their mean magnitude. From top to bottom and left to right they follow the order in Table 2. Points represent the simple average of observations obtained within the same night/epoch and error bars correspond to the error of the mean. A continuous line connects the data points while a dashed line represents a linear fit through them. Day 0 corresponds to the first observation in the VMC data. Single epoch data are included for completeness.
Current usage metrics show cumulative count of Article Views (full-text article views including HTML views, PDF and ePub downloads, according to the available data) and Abstracts Views on Vision4Press platform.
Data correspond to usage on the plateform after 2015. The current usage metrics is available 48-96 hours after online publication and is updated daily on week days.
Initial download of the metrics may take a while.