Fig. 2
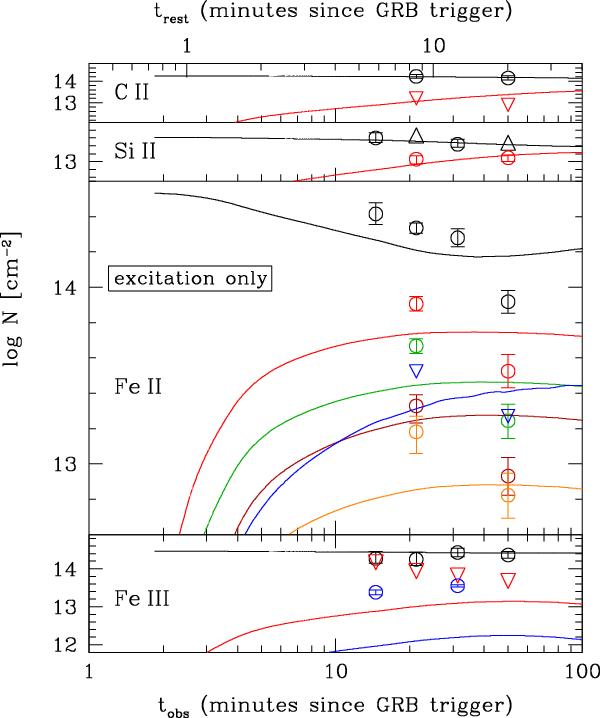
Photo-excitation modelling of the observed (total) column densities as a function
of time, as measured in Paper I (see their Table 3), for C ii,
Si ii, Fe ii and Fe iii. The open circles are
detections, while the open triangles indicate upper or lower limits
(3σ). The different colours denote the different ion levels:
black for the ground state and red-green-maroon-orange for the first four excited
levels, while the Fe ii and
Fe iii
and
Fe iii levels are indicated in blue. The model fit describes the observed column
densities very poorly, with a reduced chi-square of
levels are indicated in blue. The model fit describes the observed column
densities very poorly, with a reduced chi-square of
 .
.
Current usage metrics show cumulative count of Article Views (full-text article views including HTML views, PDF and ePub downloads, according to the available data) and Abstracts Views on Vision4Press platform.
Data correspond to usage on the plateform after 2015. The current usage metrics is available 48-96 hours after online publication and is updated daily on week days.
Initial download of the metrics may take a while.