Fig. 5
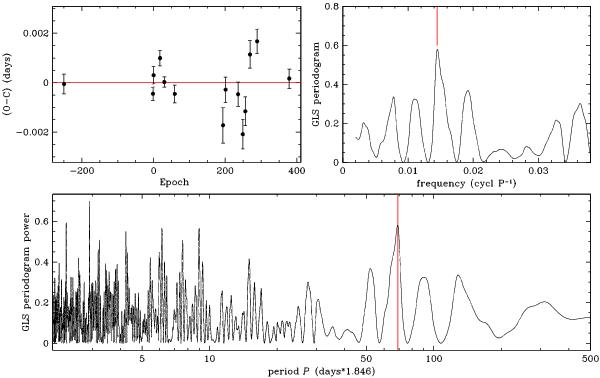
Period analysis carried out on the same set of O − C data points analyzed by Maciejewski et al. (2010). Upper left panel: O−C diagram for the selected points. Upper right panel: GLS periodogram as a function of frequency ν, adopting the same plotting limits as Maciejewski et al. (2010). Bottom panel: GLS periodogram as a function of period, adopting wider limits on frequency according to the Nyquist criterion (see text for details). The red vertical line marks the peak claimed by Maciejewski et al. (2010).
Current usage metrics show cumulative count of Article Views (full-text article views including HTML views, PDF and ePub downloads, according to the available data) and Abstracts Views on Vision4Press platform.
Data correspond to usage on the plateform after 2015. The current usage metrics is available 48-96 hours after online publication and is updated daily on week days.
Initial download of the metrics may take a while.