Free Access
Fig. 5
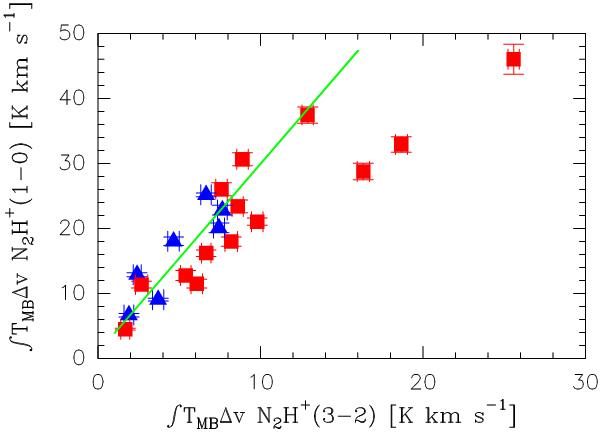
N2H+(1–0) integrated intensity versus N2H+(3–2) integrated intensity for all detected sources. The blue triangles represent clumps in peaked clouds, while the red squares represent sources in multiply peaked clouds. The green solid line marks the trend of the observed ratio of 2.9.
Current usage metrics show cumulative count of Article Views (full-text article views including HTML views, PDF and ePub downloads, according to the available data) and Abstracts Views on Vision4Press platform.
Data correspond to usage on the plateform after 2015. The current usage metrics is available 48-96 hours after online publication and is updated daily on week days.
Initial download of the metrics may take a while.