Fig. 2
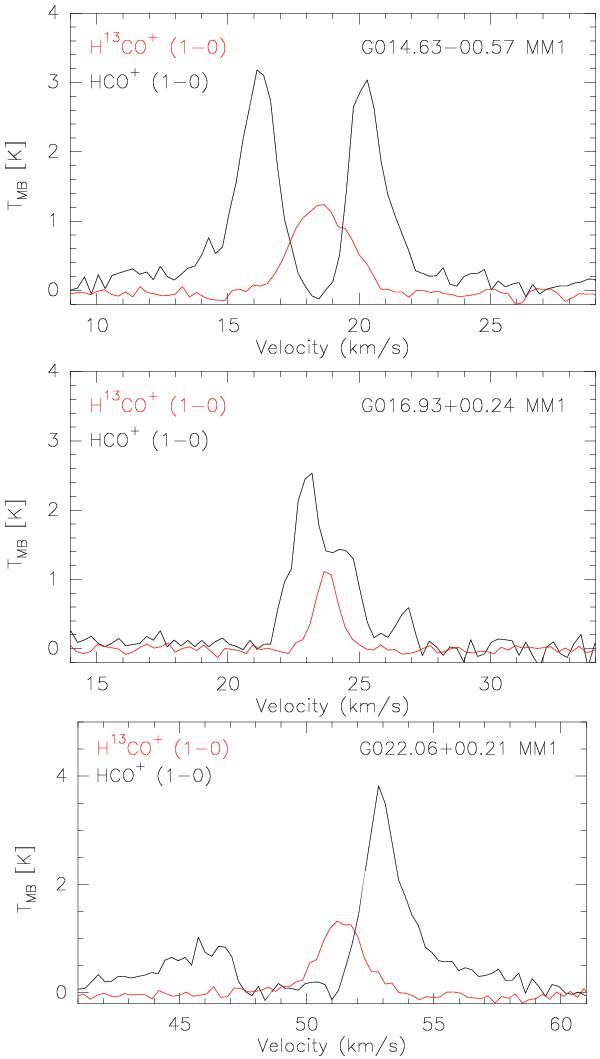
Three examples of infall/outflow signatures of the HCO+(1–0) line profile. Red marks both H13CO+(1–0), which is optically thin, and the systemic velocity of the dense gas. Compared to this the shift of the peak of the HCO+(1–0) emission, in black, becomes clear. The panels show infall (middle and bottom), outflow (bottom right), and a case of central self-absorption, where both peaks are equal (top). The profiles show various degrees of self-absorption.
Current usage metrics show cumulative count of Article Views (full-text article views including HTML views, PDF and ePub downloads, according to the available data) and Abstracts Views on Vision4Press platform.
Data correspond to usage on the plateform after 2015. The current usage metrics is available 48-96 hours after online publication and is updated daily on week days.
Initial download of the metrics may take a while.