Fig. 11
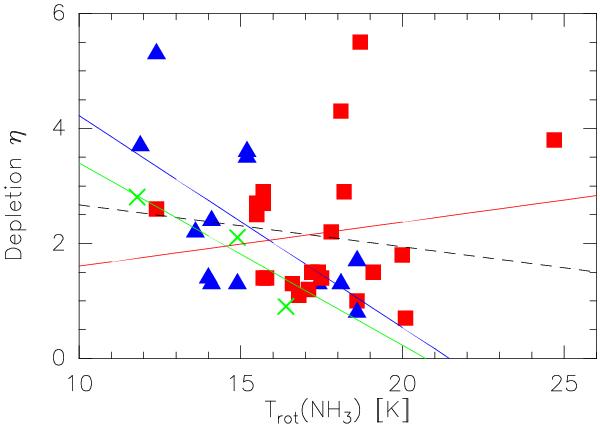
CO depletion versus the rotational temperature derived from NH3. The green crosses represent sources in diffuse clouds, the blue triangles clumps in peaked clouds, and the red squares sources in multiply peaked clouds. The black dashed line marks the trend of an increase in CO depletion with colder temperatures for all the clumps, while the green, blue, and red solid lines mark the trends for the sources in diffuse, peaked, and multiply peaked clouds.
Current usage metrics show cumulative count of Article Views (full-text article views including HTML views, PDF and ePub downloads, according to the available data) and Abstracts Views on Vision4Press platform.
Data correspond to usage on the plateform after 2015. The current usage metrics is available 48-96 hours after online publication and is updated daily on week days.
Initial download of the metrics may take a while.