Fig. 1
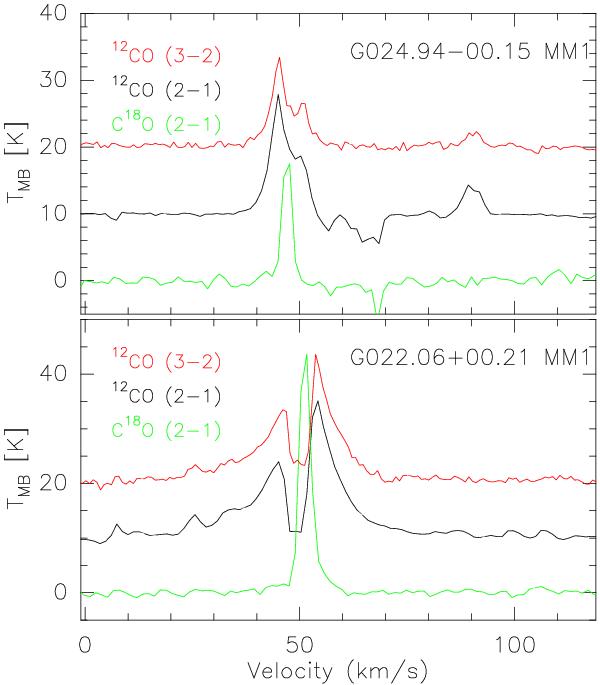
Two examples of infall/outflow signatures of the 12CO line profiles. The optically thin C18O(2–1) emission (scaled for better visibility, shown in green) indicates the systemic velocity. The CO(2–1) and CO(3–2) emission is shown in black and red, respectively. The panels show infall (top ) and outflow (bottom).
Current usage metrics show cumulative count of Article Views (full-text article views including HTML views, PDF and ePub downloads, according to the available data) and Abstracts Views on Vision4Press platform.
Data correspond to usage on the plateform after 2015. The current usage metrics is available 48-96 hours after online publication and is updated daily on week days.
Initial download of the metrics may take a while.