Fig. 7
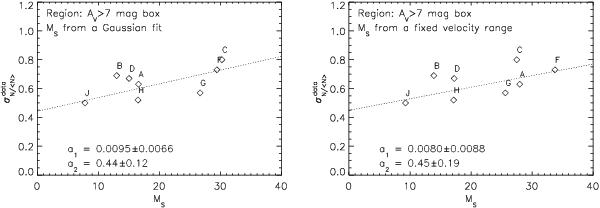
Standard deviation of the mean-normalized column densities,
 ,
as a function of the sonic Mach number, ℳs, in eight IRDCS. The Cloud E
is not included in the plot, because of the potential problems in the extinction
data of the cloud (see Sect. 2.4). The Cloud I
is also excluded because of nebulosity in the cloud region. The left
frame shows the relation when ℳs is calculated from Gaussian
fits to the mean spectra. The right frame shows the relation when
ℳs is calculated from a fixed velocity range (see Sect. 2.4). The AV = 7 mag
box was to define the cloud region that was included in the plots (see Sect. 3.2).
,
as a function of the sonic Mach number, ℳs, in eight IRDCS. The Cloud E
is not included in the plot, because of the potential problems in the extinction
data of the cloud (see Sect. 2.4). The Cloud I
is also excluded because of nebulosity in the cloud region. The left
frame shows the relation when ℳs is calculated from Gaussian
fits to the mean spectra. The right frame shows the relation when
ℳs is calculated from a fixed velocity range (see Sect. 2.4). The AV = 7 mag
box was to define the cloud region that was included in the plots (see Sect. 3.2).
Current usage metrics show cumulative count of Article Views (full-text article views including HTML views, PDF and ePub downloads, according to the available data) and Abstracts Views on Vision4Press platform.
Data correspond to usage on the plateform after 2015. The current usage metrics is available 48-96 hours after online publication and is updated daily on week days.
Initial download of the metrics may take a while.