Fig. 6
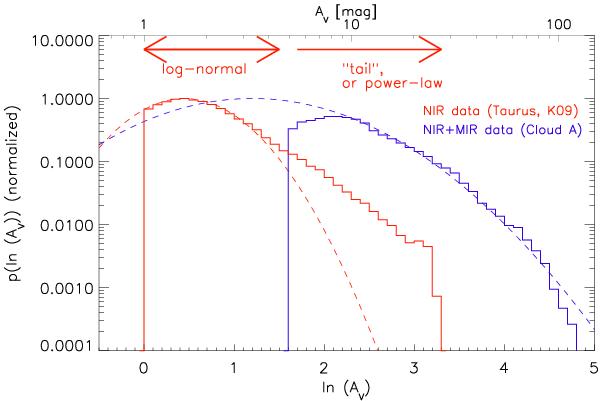
Column density PDFs of a nearby star-forming cloud (Taurus, red histogram) from K09 and one IRDC of this study (Cloud A, blue histogram). In K09, the different parts of the PDFs are referred to as “log-normal” and a “tail” (or, a “power-law)”. The ranges of these two components are indicated in the figure with red arrows. The red dashed line shows a log-normal fit to the “log-normal” part of the PDF. The blue dashed line that shows a log-normal fit to the IRDC data results to a clearly wider log-normal function than those discussed by K09. As the figure indicates, the log-normals we fit to IRDC data are relatively close in their shape to the “power-law tails” discussed by K09 in the range AV = 7−25 mag.
Current usage metrics show cumulative count of Article Views (full-text article views including HTML views, PDF and ePub downloads, according to the available data) and Abstracts Views on Vision4Press platform.
Data correspond to usage on the plateform after 2015. The current usage metrics is available 48-96 hours after online publication and is updated daily on week days.
Initial download of the metrics may take a while.