Fig. 4
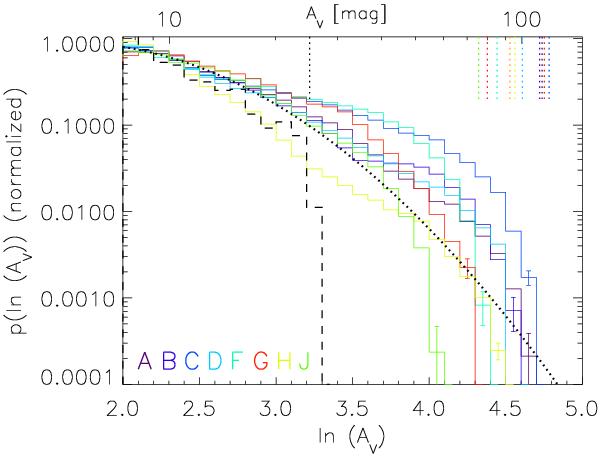
Column density PDFs of the IRDCs in the sample. The PDFs are normalized so that a linear fit to the range lnAV = 2−3 fulfills the boundary condition p(lnAV = 2.0) = 1. The dashed histogram shows the PDF of the Ophiuchus cloud from K09. The black dotted vertical line marks the upper limit of the K09 data (AV = 25 mag). The black dotted curve shows, for reference, a log-normal function with μ = 1.2, σlnN = 0.9 (not a fit). The colored vertical dotted lines show the saturation limits of the IRDCs.
Current usage metrics show cumulative count of Article Views (full-text article views including HTML views, PDF and ePub downloads, according to the available data) and Abstracts Views on Vision4Press platform.
Data correspond to usage on the plateform after 2015. The current usage metrics is available 48-96 hours after online publication and is updated daily on week days.
Initial download of the metrics may take a while.