Fig. 3
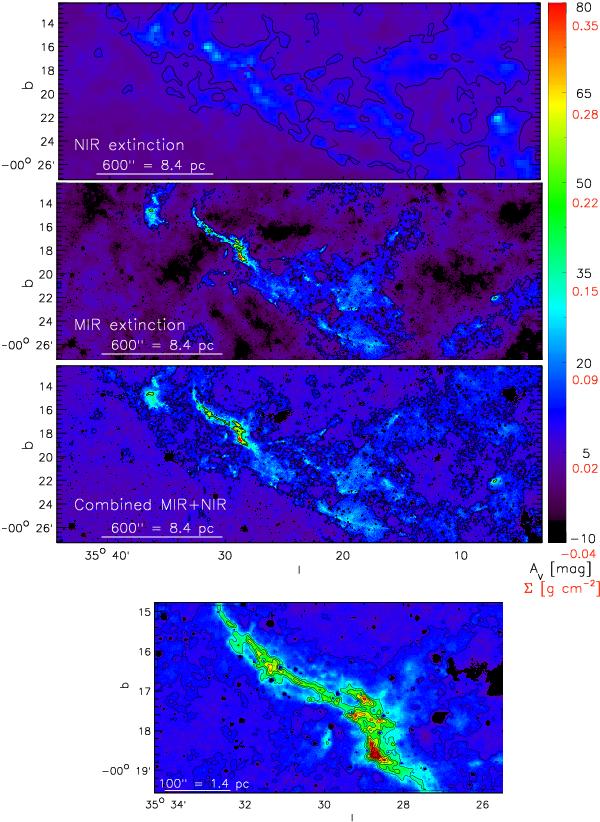
Column density maps of the H cloud. The contours in the three-panel figure are at AV = { 7,40 } mag. The color scale is given in units of visual extinction, AV (black numbers), and mass surface density, Σ (red numbers). Top: the map based only on NIR data (Kainulainen et al. 2011a). Middle: the map based only on 8 um data (BT12). Bottom: the map based on combined NIR and MIR data. The standard deviation of column density values in a region about ~10′ distance from the cloud where AV < 2 mag is σ(AV) = 1.4 mag. The maximum values in the map are AV ≈ 140 mag. The separate panel at the bottom shows a blow-up of the combined extinction map. The contours are at AV = { 7,n × 10 } mag.
Current usage metrics show cumulative count of Article Views (full-text article views including HTML views, PDF and ePub downloads, according to the available data) and Abstracts Views on Vision4Press platform.
Data correspond to usage on the plateform after 2015. The current usage metrics is available 48-96 hours after online publication and is updated daily on week days.
Initial download of the metrics may take a while.