Fig. 1
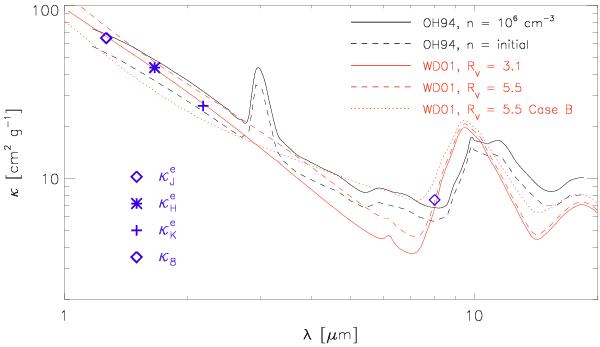
Opacity laws from Ossenkopf & Henning (1994): black dashed line – uncoagulated thin ice mantle dust model; black solid line – thin ice mantle model after coagulation for 105 y at density of n(H) = 106 cm-3; and from Weingartner & Draine (2001): red lines, models for RV = 3.1, RV = 5.5 and RV = 5.5 “case B” shown with solid, dashed, and dotted lines. The figure also shows the adopted 8 μm opacity (diamond) and the effective opacities corresponding to the empirical conversion of NIR extinction to mass surface density (symbols detailed in the panel), see Sect. 2.2.
Current usage metrics show cumulative count of Article Views (full-text article views including HTML views, PDF and ePub downloads, according to the available data) and Abstracts Views on Vision4Press platform.
Data correspond to usage on the plateform after 2015. The current usage metrics is available 48-96 hours after online publication and is updated daily on week days.
Initial download of the metrics may take a while.