| Issue |
A&A
Volume 549, January 2013
|
|
|---|---|---|
| Article Number | A104 | |
| Number of page(s) | 9 | |
| Section | Stellar structure and evolution | |
| DOI | https://doi.org/10.1051/0004-6361/201219525 | |
| Published online | 04 January 2013 | |
Low-frequency variations of unknown origin in the Kepler δ Scuti star KIC 5988140 = HD 188774⋆,⋆⋆
1
Koninklijke Sterrenwacht van België, Ringlaan 3,
1180
Brussel,
Belgium
e-mail: This email address is being protected from spambots. You need JavaScript enabled to view it.
2
Instituut voor Sterrenkunde, KU Leuven, Celestijnenlaan 200D,
3001
Leuven,
Belgium
3
Thüringer Landessternwarte Tautenburg,
07778
Tautenburg,
Germany
4
Department of Astrophysics, IMAPP, Radboud University
Nijmegen, 6500 GL
Nijmegen, The
Netherlands
5
Abastumani Astrophysical Observatory, Ilia State University,
0301
Abastumani,
Georgia
6
Konkoly Observatory of the Hungarian Academy of Sciences,
PO Box 67,
1525
Budapest,
Hungary
7
SETI Institute/NASA Ames Research Center,
Moffett Field,
CA
94035,
USA
Received: 2 May 2012
Accepted: 17 October 2012
Abstract
Context. The NASA exoplanet search mission Kepler is currently providing a wealth of light curves of ultra-high quality from space.
Aims. We used high-quality Kepler photometry and spectroscopic data to investigate the Kepler target and binary candidate KIC 5988140. We aim to interpret the observed variations of KIC 5988140 considering three possible scenarios: binarity, co-existence of δ Sct- and γ Dor-type oscillations, and rotational modulation caused by an asymmetric surface intensity distribution.
Methods. We used the spectrum synthesis method to derive the fundamental parameters Teff, log g, [M/H], and v sin i from the newly obtained high-resolution, high S/N spectra. Frequency analyses of both the photometric and the spectroscopic data were performed.
Results. The star has a spectral type of A7.5 IV-III and a metallicity slightly lower than that of the Sun. Both Fourier analyses reveal the same two dominant frequencies F1 = 2F2 = 0.688 and F2 = 0.344 d-1. We also detected in the photometry the signal of nine more, significant frequencies located in the typical range of δ Sct pulsation. The light and radial velocity curves follow a similar, stable double-wave pattern which are not exactly in anti-phase but show a relative phase shift of about 0.1 period between the moment of minimum velocity and that of maximum light.
Conclusions. Such findings are incompatible with the star being a binary system. We next show that, for all possible (limit) configurations of a spotted surface, the predicted light-to-velocity amplitude ratio is almost two orders larger than the observed value, which pleads against rotational modulation. The same argument also invalidates the explanation in terms of pulsations of type γ Dor (i.e. hybrid pulsations). We confirm the occurrence of various independent δ Sct-type pressure modes in the Kepler light curve. With respect to the low-frequency content, however, we argue that the physical cause of the remaining light and radial velocity variations of this late A-type star remains unexplained by any of the presently considered scenarios.
Key words: asteroseismology / stars: variables:δScuti / stars: atmospheres / stars: abundances / stars: rotation / stars: individual: HD 188774
Based on data gathered with NASA’s Discovery mission Kepler and with the Hermes spectrograph, installed at the Mercator Telescope, operated on the island of La Palma by the Flemish Community, at the Spanish Observatorio del Roque de los Muchachos of the Instituto de Astrofísica de Canarias, and with the 2-m Alfred-Jensch telescope of the Thüringer Landessternwarte Tautenburg.
Reduced spectra are only available at the CDS via anonymous ftp to cdsarc.u-strasbg.fr (130.79.128.5) or via http://cdsarc.u-strasbg.fr/viz-bin/qcat?J/A+A/549/A104
© ESO, 2013
1. Introduction
The NASA exoplanet search mission Kepler, launched in 2009, is currently changing our views about pulsating stars and asteroseismology thanks to the collection of light curves on all kinds of variable stars. The nearly continuous time series with micro-magnitude precision opens up opportunities for high-quality and in-depth asteroseismic studies with unprecedented detail (Jenkins et al. 2010; Chaplin et al. 2011; Bedding et al. 2011; Beck et al. 2011).
A first general characterization of the pulsational behaviour of 750 candidate A-F type stars with magnitudes between 6 and 15 observed by Kepler has been performed by Uytterhoeven et al. (2011b). In this study, 63% of the sample was assigned to one of three main classes of pulsating A-F type stars: 27% are classified as δ Sct stars (206 stars), 23% as hybrid pulsators exhibiting both δ Sct- and γ Dor-type oscillations (171 stars), and 13% as γ Dor stars (100 stars). The remaining stars were classified as rotationally modulated/active stars, binaries, or stars that show no clear periodic variability. The majority of the hybrid pulsators shows frequencies with all kinds of periodicities within the γ Dor and δ Sct range, which is a challenge for the current models. Uytterhoeven et al. (2011b) also found indications for the existence of δ Sct and γ Dor stars beyond the edges of the current theoretical instability strips, as confirmed in the studies by Grigahcène et al. (2010) and Tkachenko et al. (2012).
Ground-based follow-up observations of the Kepler targets have been organized with the goal to obtain precise fundamental parameters needed for the seismic modelling of pulsating stars (see e.g. Uytterhoeven et al. 2011a). A first sub-sample of A-F type stars has been recently presented by Catanzaro et al. (2011).
We focus here on the Kepler target KIC 5988140 (HD 188774, Kepler magnitude of 8.852). In the study by Uytterhoeven et al. (2011b), this late A/early F-type star is classified as a binary with δ Sct pulsations. At least 12% of the entire sample was identified as belonging to a binary or a multiple system. We further remark that its light curve resembles that of KIC 9664869 (see panel c of Fig. 5 in Uytterhoeven et al. 2011b) which is in turn classified as a hybrid pulsator of the middle type, i.e. neither of dominating δ Sct type nor of dominating γ Dor type. Catanzaro et al. (2011) investigated KIC 5988140 based on low and medium resolution spectroscopic data and reported the fundamental atmospheric parameters shown in Table 1. Unlike Uytterhoeven et al. (2011b), these authors concluded that KIC 5988140 belongs to the hybrid δ Sct-γ Dor class. In this study, we use new high-resolution spectra of KIC 5988140 to investigate its radial velocity (RV) curve and to re-determine its fundamental parameters, with the goal to identify the possible cause(s) of the observed photometric and spectroscopic variations.
2. Observations
Our analysis is based on high-quality photometric and spectroscopic data. The light curves have been gathered by the Kepler satellite in the so-called Long Cadence mode (with a time resolution of 29.4 min). The Kepler data are made available in quarters, i.e. periods between two spacecraft rolls. The (uncorrected) data of different quarters have different zero-points and suffer from instrumental drift which may vary from quarter to quarter. To correct for these, we used a package of Fortran routines (kindly made available by Balona), which removes the jumps between the quarters and the drifts in an automatic way. The processed data represent normalized relative intensities expressed in parts per thousand (ppt). Using this procedure may affect some of the lowest frequencies found in a period-search analysis. Balona (2011) tested this assumption and concluded that the frequencies above 0.1 d-1 are not affected, while the amplitudes of those below 0.1 d-1 may change slightly. For this case study, we analysed the Kepler data from seven different quarters, i.e. Q0-Q2, Q4-Q6, Q8, which resulted in 22 234 measurements in total and from which we extracted 20 668 useful measurements. The Nyquist frequency is 24.47 d-1 and the frequency resolution is 0.0022 d-1 (for the time base of 682 days) (Loumos & Deeming 1978). Two small aliasing peaks located at respectively 0.0033 and 0.0052 d-1, and caused by the missing quarters Q3 and Q7, can be identified in the corresponding spectral window.
We also acquired a series of high-resolution spectra in two consecutive years. In 2010, the spectra were taken with the Hermes spectrograph attached to the 1.2-m Mercator telescope (Observatorio del Roque de los Muchachos, La Palma, Canary Island). Hermes (High Efficiency and Resolution Mercator Echelle Spectrograph) is a fibre-fed spectrograph which samples the entire optical range from 380 to 900 nm with a resolution of 85 000 (Raskin et al. 2011). The spectra acquired in 2011 have been taken with the Coudé-Echelle spectrograph attached to the 2-m telescope at the Thüringer Landessternwarte Tautenburg. The Tautenburg spectra have a spectral resolution of 32 000 and cover the wavelength range from 472 to 740 nm. Exposure times of the same order as the temporal resolution of the Kepler data were used in both cases (i.e. between 6 and 30 min depending on the conditions).
The data have been reduced using the dedicated pipeline for Hermes spectra and standard ESO-MIDAS packages for the extracted, merged Hermes spectra and the Tautenburg spectra, respectively. The data reduction included bias and stray-light subtraction, cosmic rays filtering, flat fielding, wavelength calibration by ThArNe lamps, order merging, and normalization to the local continuum. All the spectra were additionally corrected in wavelength for individual instrumental shifts by using a large number of telluric O2 lines. The cross-correlation technique was used to estimate RVs of the individual spectra. All the spectra have been shifted in wavelength according to their derived RVs and co-added to build two high(er) signal-to-noise ratio (S/N) mean spectra. The Hermes (respectively Tautenburg) mean spectrum was next analysed individually. Since both analyses gave consistent results, and because the Hermes mean spectrum covers a wider spectral range and is of excellent quality (S/N = 180−200 at λ ~ 500 nm), we will refer to the latter (only) as “the mean spectrum” in the following sections.
The journal of observations is given in Table 6. The associated errors quoted in Table 6 are the 1-σ formal errors obtained during the fitting process.
3. Spectroscopy
3.1. Spectrum analysis
Fundamental parameters and the 1-σ formal errors as derived from the mean spectrum.
Abundances for individual elements sorted according to their uncertainties.
The mean spectrum of KIC 5988140 was analysed by means of the GSSP programme package (Tkachenko et al. 2012) which is based on the method of synthetic spectra. The idea is to use a large, dense enough grid of pre-computed theoretical spectra and perform a spectrum-by-spectrum comparison with the observations until a global minimum of χ2 in parameter space is found. In the first step, synthetic spectra are computed on a grid of effective temperature Teff, surface gravity log g, projected rotational velocity v sin i, microturbulent velocity ξ, and metallicity [M/H]. The derived metallicity is used as an initial guess for the chemical composition of the star and individual elemental abundances are iterated together with the other four fundamental parameters in the second step. The measurement uncertainties of Teff, log g, v sin i, ξ, [M/H], and the individual abundances are determined as 1-σ confidence levels obtained from χ2-statistics. For the calculation of synthetic spectra, we used the code SynthV (Tsymbal 1996) based on the local thermal equilibrium (LTE) theory whereas atmosphere models have been computed with the most recent, parallelized version of the LLmodels (Shulyak et al. 2004). All synthetic spectra were computed in the 3800−5700 Å wavelength region which is almost free of telluric contributions but includes several hydrogen lines of the Balmer series and a large number of metal lines. A more detailed description of the method and its application to the spectra of Kepler β Cep and SPB candidate stars as well as δ Sct and γ Dor candidate stars are given by Lehmann et al. (2011) and by Tkachenko et al. (2012), respectively.
Table 1 gives the results of the spectrum analysis in comparison with the Kepler Input Catalog (KIC) values. The errors of the KIC parameters are typical values, i.e. ±200 K for the effective temperature and ± 0.5 dex for both the surface gravity and the metallicity. The derived fundamental parameters agree within the (KIC) errors, though there is a rather large difference in the value of [M/H] between ours and the KIC one. The new fundamental parameters also agree with respect to the values reported by Catanzaro et al. (2011). Spectral types and the luminosity classes listed in Table 1 were derived using interpolation in the tables published by Schmidt-Kaler (1982).
Table 2 lists the abundances of individual elements as determined from the mean spectrum. Apart from Sr, Ba, and Eu, the abundances of all elements are compatible with the derived metallicity of the star. The three elements mentioned above show considerable overabundances but their uncertainties are also large.
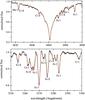 |
Fig. 1 Fit of the observed spectrum of KIC 5988140 (black) in two different wavelength regions assuming Teff = 7600/7400 K, log g = 3.4/3.5 and [M/H] = –0.3/–0.5 dex (resp. dashed red and dotted green lines). A colour plot is provided in the online version. |
 |
Fig. 2 Successive periodograms of the ground-based RV data of KIC 5988140 (top: spectral window, bottom: after prewhitening for F1 and F2). |
Figure 1 shows parts of the observed spectrum (black line) in comparison with the two synthetic spectra computed respectively based on the parameters derived by us (dashed line) and on those listed in the KIC (dotted line). Obviously, the newly derived fundamental parameters provide a better fit of the observed spectrum in both illustrated wavelength regions. The same is true for the majority of the other metal lines found in the considered wavelength range.
3.2. Radial velocity variations
The RVs measured (by cross-correlation, see Sect. 2) from all recently observed spectra (i.e. 40 measurements in total as listed in Table 6) were searched for possible periodicities by means of the Period04 programme (Lenz & Breger 2005). Figure 2 illustrates the Fourier spectrum of the RV data set. The corresponding spectral window reveals the presence of the 1 year-1 as well as 80% high 1 day-1 alias peaks. The dominant period P1 is detected at 1.4534 ± 0.0085 d. After prewhitening with the corresponding frequency F1 = 0.6880 ± 0.0038 d-1, a Fourier analysis of the residuals reveals a second significant frequency F2 = 0.3440 ± 0.0002 d-1 corresponding to the period P2 = 2.9070 ± 0.0002 d (see Table 3). We computed 100 Monte Carlo simulations to estimate the errors on the frequencies and amplitudes (cf. Period04). This second frequency appears quite significantly after prewhitening, and is not affected by the aliasing peaks located at ~0.5 d-1 in the spectral window (as will be confirmed in Sect. 4). We also remark that the ratio between both frequencies is exactly 2. The third frequency, F ∗ = 0.0013 d-1, is apparently caused by a small shift in zero-point between the RVs originating from two different instruments. We kept its value fixed during the Monte Carlo error computations. The tabulated amplitude-to-noise ratios much larger than 4.0 (Breger et al. 1993) show that all three frequencies are significant. The fraction of the variance removed after prewhitening with three frequencies, (1 − R), equals 87%.
Figure 3 illustrates the RV curve based on the Tautenburg and Hermes spectra, phased on the period P2 (top), as well as a small portion of the Kepler light curve (bottom). Phase zero in the RV curve corresponds to the time of the highest maximum observed in this part of the light curve which occurs at (B)JD 2 455 087.62. The following ephemeris has been adopted:  The RVs thus folded follow a clear double-wave pattern (two maxima, two minima). Apart from its obvious double-wave shape, the mean radial velocity curve appears slightly anharmonic (the phase difference between the first two periodic signals equals 0.34, see Table 3).
Frequencies detected in the RV data of KIC 5988140.
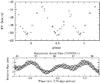 |
Fig. 3 Top: RVs of KIC 5988140 folded on the period P2 ~ 2.91 d. Hermes RVs are indicated by triangles and TLS ones by open circles. Bottom: portion of the Kepler light curve illustrating the near 2-h period oscillations. The X-axis shows both BJD and phase. In both panels, phase zero refers to (B)JD 2 455 087.62. |
3.3. Least-squares deconvolution
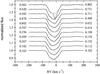 |
Fig. 4 LSD-profiles computed based on the individual (solid) and mean (dashed) spectra. |
A fit of the mean, observed spectrum of KIC 5988140 by the synthetic one provides quite smooth residuals indicating that this is not a double-lined spectroscopic binary. High S/N averaged profiles computed by means of the least-squares deconvolution (LSD) technique (Donati et al. 1997) confirm this finding. Figure 4 illustrates the profiles computed from 11 Tautenburg spectra (solid) which are shifted in Y-axis for clarity. The phases indicated on the plot to the left and to the right of the profiles were computed assuming two different periods, P1 and P2, respectively, and the time of minimum corresponding to the deepest minimum in the Kepler light curve (at BJD ~ 2 455 085.50, cf. Figure 3, bottom part). The LSD-profile computed from the mean spectrum which has been used for the detailed analysis in Sect. 3.1 is shown by a dashed line for comparison. Obviously, there is no indication of a secondary component in the spectra. The first profile from the top appears to be highly asymmetric and has a shape typical of that caused by the Rossiter-McLaughlin effect (McLauglin 1924; Rossiter 1924). However, the computed phases indicate that the corresponding spectrum has been taken at the phase near a time of secondary maximum light in the Kepler light curve and not during the eclipse phase. This fact allows to exclude eclipses as a possible explanation for the observed anomalous shape of spectral lines at this phase, thus the nature of the anomaly remains unclear. On top of that, there are also obvious line profile variations occurring on a short time scale which might be caused by stellar oscillations (cf. Sect. 4).
4. Kepler photometry
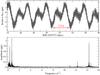 |
Fig. 5 Part of the Q6-quarter of the Kepler light curve of KIC 5988140 (top) and amplitude spectrum of the entire Q6-quarter data string (bottom). |
Similar to the analysis of the spectroscopic data, a search for periodicities has been performed using the Period04 programme. Figure 5 represents a 2-weeks long string of the Q6 Kepler light curve (top) together with the amplitude spectrum based on the entire Q6-quarter data string (bottom). The highest peak appears at the frequency of 0.687993 d-1 (P1 = 1.45350 d), followed by the frequency of 0.343984 d-1 (P2 = 2.90711 d). This result is entirely consistent with the results from the Fourier analysis of the RVs (cf. Table 3). Note that the phase difference between the first two periodic signals is 0.52, therefore not exactly matching the one from the radial velocity curve. The ratio F1/F2 equals the factor 2, which could in principle be explained as tidal modulation in a close binary system (e.g. in ellipsoidal systems), but this explanation is not corroborated by the facts that the same factor appears in the frequency-analysis of the RVs nor that the total RV amplitude is very low. Besides the peaks corresponding to the periods P1 and P2, the frequency analysis of the complete data set revealed the existence of at least twenty-five more frequencies, with a significance above ten times the noise level in Fourier space. While most of these are located <0.1 d-1 indicating either long-term changes or remaining instrumental effects (see cautionary note from Sect. 2), some are obviously harmonics of P2: apart from P1 = P2/2, we also find P2/3, P2/4, and P2/5. However, more significant is the detection of nine frequencies located beyond 10 d-1: they all appear to lie in the typical δ Sct range (see Table 4). As before, the errors on the frequencies and amplitudes were computed based on Monte Carlo simulations, except for F1 which was kept fixed with respect to F2 (cf. Period04). The fraction of the variance removed after prewhitening with 27 frequencies (i.e. after removal of the 27 first frequencies), (1 − R), equals 99%. Figure 3 (bottom) shows a randomly selected light curve portion illustrating the short-period variations over one and a half full cycle with respect to P2. Besides the fact that the RV-curve appears to be lagging in phase behind the light curve folded on P2 by at least 0.2 period (i.e. maximum to maximum), a very clear beating of the most significant frequency located at 14.32981 d-1 (corresponding to a pulsation period of 1h40m) can be seen, caused by the presence of six more frequencies located between 14 and 15 d-1. Among these, a few frequency spacings are repeatedly occurring. For example, the frequencies F3, F7 and F23 are separated by almost exactly 0.040 d-1. The couples (F5, F9) and (F19, F5) show a difference of 0.31 and 0.26 d-1, respectively. Two other δ Sct-type frequencies are F4 = 12.28328 d-1 and F14 = 10.91996 d-1 (with respective period ratios of 0.86 and 0.76). The latter is an interesting period ratio, close to the ratio 1H/F expected for radial modes in such a star. The occurrence of F17 = 23.89006 d-1, on the other hand, is questionable, since it lies very close to the Nyquist frequency of the data set. We further notice the presence of various long-term periodicities (frequencies <0.01 d-1) which appear with a low significance, though none as small as the frequency of 0.001 d-1 found in the RV data (cf. Sect. 3.2). We also recall that such very low frequencies might be affected by the data (pre)processing algorithms.
Next, we tested the stability of the properties of the δ Sct-type pulsations by searching for a best-fit model allowing for a periodic variation of the phase shifts of these frequencies in the multi-parameter solution. For this, we used the model called “Periodic Time Shift” in Period04 (cf. PTS model under expert mode). The computations show that no better fit can be found by including a possible (long-term) variation of the phase shifts which might possibly be due to a modulation by either one of the low frequencies P1 or P2. Our conclusion is that the properties of the δ Sct-type frequencies are stable.
Over 25 frequencies detected in the photometry of KIC 5988140.
We also verified the stability of the shape of the “basic” light curve (i.e. cleaned for the near 2h-period variations and the long-term trends) based on the main frequency and the harmonics by prewhitening with all other frequencies detected during the Fourier analysis, and by plotting the folded residual light curve using colours for different subsets. Figure 6 shows the resulting phase diagram when subdividing the data into bins of tens of days. We see no obvious temporal change in the shape of this curve. As an independent test, we divided the “basic” Kepler light curve into different cycles and fitted each with a 4th-order trigonometric polynomial according to 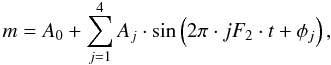 (1)where m is the magnitude, Aj is the amplitude, jF2 stands for the frequency F2 and its harmonics, t is the time of the observation, φj is the phase and index j runs from 1 to 4. Then, we characterised each cycle by its Fourier coefficients (Simon & Teays 1982). In Fig. 7, we represent the amplitude, A1, and the relative variations of the parameters R21 = A2/A1, R31 = A3/A1 as a function of time. The amplitude A1 shows a scatter of about 0.08 ppt which is ten times larger than the average fit error (~0.008 ppt). While the relative scatter of R21 is small, the relative scatter of R31 is more important, but considering that the amplitude A3 is much smaller, than A1, the corresponding variation remains insignificant and we find no clear trend. This demonstrates that the “basic” light curve is stable over a period of almost two years (T = 682 days).
Considering that the time resolution in Long Cadence mode is of the order of 30 min, we must caution the determination of the amplitudes of the δ Sct-type frequencies in Table 4. Whereas the amplitudes in the low-frequency regime may be correctly evaluated, the ones in the high-frequency regime might actually be slightly underestimated.
Making use of Figs. 3 and 6, we can also verify the phase relationship between the “basic” light and RV curves: both curves are not exactly in anti-phase with respect to each other: the moments of minimum RV precede the moments of maximum light by about 0.1 period.
After prewhitening for all the frequencies listed in Table 4, the final residuals (see Fig. 8) do not look perfectly flat, as one would expect, but reflect small instrumental effects and reveal discontinuities which were not accounted for during the homogeneization (pre)processing.
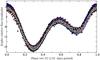 |
Fig. 6 “Basic” light curve of KIC 5988140 based on all the data and folded on the period P2 (after prewhitening for 23 frequencies). |
 |
Fig. 7 Temporal evolution of the (relative) amplitudes A1 and R21, R31 of the “basic” light curve of KIC 5988140. |
 |
Fig. 8 Residual light curve of KIC 5988140 based on all the data (after prewhitening for 28 frequencies). |
5. Discussion
It seems that Uytterhoeven et al. (2011b) based their binary classification on the morphology and the high regularity of the light curve (see Fig. 5), where the deepest minima, occurring every ~2.91 days, could be attributed to primary eclipses. Our Fourier analysis of the Kepler data reveals the existence of multiple frequencies, with the highest amplitude peaks occurring at the frequencies of 0.687993 d-1 (P1 = 1.45350 d) and 0.343984 d-1 (P2 = 2.90711 d), with an exact integer ratio of 2, the first harmonic term being the most significant. A Fourier analysis of the ground-based RV data indicates the same frequencies, moreover in the same order of importance, hence showing the double-wave shape. The fact that a double-wave pattern, almost but not exactly in anti-phase with the light curve (Sect. 4), is also detected in the radial velocity phase diagram excludes binarity as a possible cause of the observed low-frequency variability. Moreover, the total RV amplitude of almost 8 km s-1 is too small for a short-period binary system with a primary of spectral type A, unless the inclination angle would be very low (in that case, we would not detect any feature resembling an eclipse).
We next consider the model of rotational modulation generated by an asymmetric intensity distribution on the stellar surface. The latter could be (a) due to the presence of stellar spots on the surface, or (b) caused by a (thin) convection zone located on or near the surface.The RVs folded on the period of ~2.91 d (see Fig. 3, top) show a double wave which could be explained by a surface structure that includes two spots diametrically opposed to one another. The same is also true for the double-wave pattern detected in the Kepler light curve. That a harmonic of the rotation period of the star has the highest amplitude in the RV data, was previously found in some spotted stars, e.g., in the He-weak silicon star HR 7224 (Lehmann et al. 2006). On the other hand, both the spectral type (late A) and the long-term stability of the “basic” light curve over a period of about 2 yrs argue against variability due to stellar spots for this object.
Usually, we don’t expect magnetic activity (causing spots on the stellar surface) nor convection to occur in the atmospheres of normal A-type stars. However, convection does occur in some late A-type stars, and particularly in the photosphere where it competes with radiation transporting the flux. The case of Altair is illustrative: this fast rotating A-type star has a broad equatorial band at Teff = 6900 K which gives rise to strong convection and chromospheric activity like C II emission (Peterson et al. 2006). Using an XMM-Newton observation, Robrade & Schmitt (2009) confirmed the presence of (coronal) X-ray emission and weak magnetic activity. Altair indeed belongs to the transition region where stars can develop envelopes in-between fully radiative and fully convective ones. Based on observations collected by the Wide Field Infrared Explorer (WIRE) satellite, Buzasi et al. (2005) showed that it is also a very low-amplitude δ Sct star (with Δm < 1 ppt). Interestingly, in addition to the frequencies detected in the 15–29 d-1 range, the existence of two frequencies in the low range, namely at 3.53 and 2.57 d-1 (cf. their Table 1) is demonstrated. Using long-baseline interferometry, Peterson et al. (2006) derived the rotational frequency of 2.71 d-1, which is close to the lowest frequency detected by Buzasi et al. (2005). In essence, both Ohishi et al. (2004) and Peterson et al. (2006) conclude that the surface of Altair displays an extremely asymmetric intensity distribution and that the asymmetry is consistent with that expected from the known high rotation and oblateness. It thus appears that the rotationally distorted stellar surface of Altair induces low amplitude modulations which are detectable in the high-quality light curves from space. We can ask ourselves whether KIC 5988140 might be similar to Altair or to the weakly active, X-ray emitting A5/F0-type star HR 8799 (Robrade & Schmitt 2010).
Adopting the radius of 3.57 R⊙ (R ∗ ) listed in the KIC, we estimate a rotation period of ~3.7 d (reciprocal of 0.27 d-1) and of ~2.5 d (reciprocal of 0.40 d-1) for an inclination angle of 90° and 45°, respectively. The detected period of 2.90711 d lies in-between these two derived periods. We point out that there is also a triplet of frequencies (F9,5,19) which has a frequency spacing of the order of 0.3 d-1 that could be explained as rotational splitting of a single, independent frequency. Using Vequat = 50.61 × R ∗ /P2 = 62.3 km s-1 and the measured v sin i we obtain an inclination angle of ~50°, which is a most reasonable value. We next attempted to find a model including two hot spots symmetrically located on opposite sides of the stellar equator in order to explain the patterns in both the light and the RV curves. For this, we used a simple model in which the stellar surface has intensity I0, including a standard law for the limb darkening, the spots have a size FWHMi (corresponding to the Full Width at Half Maximum or FWHM) and a Gaussian intensity distribution of amplitude Ai. The following formula was adopted: 
![Mathematical equation: \begin{equation*} spot_i = A_i \cdot \exp{\left[-\ln({2})(r_i/FWHM_i)^{2}\right]} \end{equation*}](/articles/aa/full_html/2013/01/aa19525-12/aa19525-12-eq96.png) and
and  where ri is the distance on the stellar surface from the centre of spot i and z is the distance from the centre of the visible disk. For the intrinsic absorption line profile, we used a Gaussian having a width corresponding to ξ = 3.16 km s-1. The resulting line profiles are obtained by integrating over the visible surface where each point has a velocity corresponding to v sin i = 52 km s-1. Deduced RVs represent the first moments of the line profiles.
We chose spot sizes and amplitudes such as to reproduce the observed total amplitude of the RV curve. Figure 9 illustrates two cases. In the first case (model A), we chose a maximum size of both spots equal to the stellar radius. An amplitude A1 = 0.78 was needed to reproduce the observed RV amplitude of 8 km s-1. In the second case (model B), we chose a size FWHM = R ∗ /30 and needed an amplitude A1 = 23 (A2 was chosen a bit smaller in each case to reproduce the observed asymmetry). Model B was (only) selected as the opposite limit case, since such a small and bright spot would produce bumps moving across the line profiles (which were not detected). Figure 10 shows the resulting RV and light variations. Both models predict intensity changes with a total amplitude of about 20%, i.e. a factor of 40 larger than the observed one (max. 5 ppt peak-to-peak). Varying the shape of the spots (exponential instead of Gaussian), their position in latitude, their separation in longitude, or the inclination of the rotation axis did not yield a better agreement. Thus, the small value of the observed light-to-velocity amplitude ratio cannot be explained by a (simple) spotted surface model. The same argument also invalidates the assumption that KIC 5988140 might have a partially convective atmosphere (along with the fact that it has a low probability of being a fast rotator with v sin i = 52 km s-1assuming that P2 is the rotation period).
Spots will show as regions of different chemical composition on the stellar surface. To verify this, we performed separate analyses of four Hermes spectra taken at four different phases of the period P2 (e.g. the extrema of the light curve) to look for possible changes in the derived abundances and/or stellar parameters. These results are summarized in Table 5. The largest deviations in Teff, log g, and ξ are respectively 80 K, 0.1 dex and 0.3 km s-1, which is comparable to the uncertainties listed in Table 2. Both the metallicity and v sin i are stable. We may therefore conclude that there is no obvious difference in the obtained fundamental parameters nor in the individual abundances with respect to phase.
Results of the analysis of four individual spectra of KIC 5988140 taken at four different phases of the period P2.
 |
Fig. 9 Spot models A (left) and B (right) shown for a certain rotation phase and drawn on separate greyscales to cover the full brightness range of both cases. |
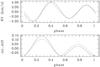 |
Fig. 10 RV and relative intensity variations for spot models A (solid) and B (dashed). |
Third, nine of the photometrically detected frequencies (F3,4,5, F7, F9, F13, F14, F19, F23, see Table 4) lie in the typical δ Sct range. Observed regular spacings are of the order of 0.3 and 0.04 d-1. The question thus remains if the frequencies F1 and F2 (and the harmonics) can possibly be related to the γ Dor-like oscillations, which would confirm its classification as a δ Sct-γ Dor hybrid star by Catanzaro et al. (2011). However, and most importantly, the same reasoning as presented in the model involving rotational modulation is applicable here: if the RV variations were caused by pulsations, we would expect to detect light variations with a total amplitude in scale with the one of the RVs (assuming that low-degree modes only are excited). The light-to-velocity amplitude ratio for slowly pulsating B stars lies around 4−5 mmag/km s-1 (based on 13 confirmed cases, cf. top panel of Fig. 19 in De Cat & Aerts 2002). Assuming that this ratio is also valid for γ Dor stars (e.g. from Table 2 in Aerts et al. 2004, we have a mean amplitude ratio of 15 mmag/km s-1 from two γ Dor stars), we would expect a total amplitude of about 32−40 mmag in the “basic” Kepler light curve, i.e. 3−4%. We are (again) one order below this expected value with the observed total amplitude of the “basic” light curve (max. 5 ppt). Indeed, the problem of the unbalanced light-to-velocity amplitude ratio remains with this explanation too. Other, less critical, counter-indications are: (1) γ Dor stars are typically multi-periodic pulsators; (2) the small integer ratio of 2 between the two most dominant frequencies is unexpected in the case of (non-radial) pulsators which are not a member of a binary system; (3) the existence of more harmonic frequencies; (4) this star is perhaps too evolved to be a γ Dor-type pulsator (cf. its position in the H-R diagram); and (5) the previously derived phase relationship (Sect. 4) is unusual in the case of pulsation, as the moments of minimum RV (i.e. maximum surface layer expansion) generally follow the moments of light maximum (e.g. in δ Scuti stars, see Preston & Landolt 1999).
Journal of recent spectroscopic observations and radial velocities.
6. Conclusion
KIC 5988140 (HD 188774) was assigned a spectral type of A7.5 IV-III which, along with its atmospheric parameters and abundances (see Tables 1 and 2), puts it in the middle of the δ Sct and just at the blue edge of the γ Dor instability strips (Fekel et al. 2003). The presence of the multiple frequencies in the range 10–15 d-1 detected from the Kepler photometry is firm evidence that the star is a δ Sct pulsating star. The apparently slightly more dominant low frequencies detected in both the RV data and in the Kepler photometry, identified as one major frequency with harmonics, may be caused by (at least) three very different physical processes: a) binarity, b) rotation in combination with an inhomogeneous surface intensity/chemical distribution or c) γ Dor-type pulsation in the gravity-mode regime.
In our case, we are left with an open question regarding the phenomenon which causes the detected low frequencies in KIC 5988140 as none of the abovementioned scenarios gives an entirely satisfactory explanation for the observed variability patterns discovered in this late A-type star. It seems indeed difficult to reconcile the Kepler light curve with the ground-based RV curve. We discarded binarity on the basis of the double-wave pattern detected in the RV curve. This is a strong argument. The light-to-velocity amplitude ratio is an obstacle for the other two scenarios: that of rotational modulation as well as that of pulsations. It might be that our simple modelling of stellar spots is lacking some reality, but we believe that it, at least qualitatively, shows the order of the expected effects.
This reminds us of another still unexplained behaviour observed by Kepler: the fact that the Kepler light curves of many A- and F-type stars show variability at low frequencies (Balona 2011). The author analysed the distributions of v sin i derived on the basis of the (dominant) low frequencies and those of the observed rotational frequencies and showed that both agree rather well assuming that the value of the dominant low frequency is the rotational period. In the specific case of the δ Sct stars observed by Kepler, assuming that half of the value of the dominant low frequency is the rotational period, Balona (2011) found a good agreement between both (observed and derived) v sin i distributions. On the other hand, Grigahcène et al. (2010) proposed that most Kepler δ Sct stars are of the hybrid type where the low frequencies are due to the γ Dor phenomenon. An explanation for this behaviour is currently needed.
KIC 5988140 is most likely not unique amongst the Kepler A-type stars. However, it is one of the first cases where a high-quality data set in RV has been collected and confronted to the photometry. Because of the difficulty in finding a plausible explanation for the cause of the observed variations, we might consider the more complex model of a triple system to explain the double wave detected in the RV curve. We can exclude a hierarchical system consisting of a single star and a binary based on the stability criterion because of the 1:2 ratio of the long-term frequencies. On the other hand, a single star revolved by two satellites could be stable. From the periods and the RV amplitudes, using a typical mass of 2−3 M⊙ for the A-type star, we estimate masses in the range of brown dwarfs to M-dwarfs for both objects, namely in the range 20−220 Jupiter masses depending on the orbital inclination angle. However, these satellites would have very small semi-major axes of about 8 and 12 R⊙ and we cannot tell anything yet about the stability of such close orbits in a 1:2 resonance. From stability considerations, the low-mass objects (i.e. brown dwarfs) seem to be more likely. Whether such a scenario might also explain the observed photometric variations by reflection (including ellipsoidal variability as well as beaming effects), is presently uncertain and will require an in-depth analysis. We present this idea merely as a possible working hypothesis for our future work on this intriguing Kepler star.
One should pay attention to other cases in the Kepler field which might show the same difficulty in interpretation. This reminds us that, without complementary (even ground-based) information in the form of spectroscopy and/or multi-colour photometry, any interpretation based on single-passband light curves alone may be biased. A valuable method allowing to distinguish between binarity, rotational modulation or pulsations of type γ Dor would be to collect amplitude ratios in multiple passbands (e.g. Henry et al. 2007). To perform such a task at the
required scale and accuracy level will however most certainly necessitate future space resources.
As illustrated by this study, the acquisition of high-quality ground-based spectra can provide relevant, new information for a more thorough understanding of the hyper-quality white-light stellar photometry provided by the space missions.
Acknowledgments
The research leading to these results received funding from the European Research Council under the European Community’s Seventh Framework Programme (FP7/2007–2013)/ERC grant agreement No. 227224 (PROSPERITY). Part of this work was also supported by the Hungarian grants OTKA K76816, K83790, an Eötvös fellowship, and by the János Bolyai Research Fellowship and the “Lendület-2009” Young Researchers Program of the Hungarian Academy of Sciences. Funding for the Kepler mission is provided by NASA’s Science Mission Directorate. We thank the whole team for the development and operations of this remarkable mission. We furthermore thank Drs. E. van Aarle and B. Vandenbussche (KU Leuven) for help with the acquisition of some of the Hermes spectra, Drs. V. Antoci and G. Handler for helpful discussions, and the referee for valuable comments. This research made use of the SIMBAD database, operated at CDS, Strasbourg, France, and the SAO/NASA Astrophysics Data System.
References
- Aerts, C., Cuypers, J., De Cat, P., et al. 2004, A&A, 415, 1079 [NASA ADS] [CrossRef] [EDP Sciences] [Google Scholar]
- Asplund, M., Grevesse, N., Sauval, A. J., & Scott, P. 2009, ARA&A, 47, 481 [NASA ADS] [CrossRef] [Google Scholar]
- Balona, L. A. 2011, MNRAS, 415, 1691 [NASA ADS] [CrossRef] [Google Scholar]
- Beck, P. G., Bedding, T. R., Mosser, B., et al. 2011, Science, 332, 205 [NASA ADS] [CrossRef] [PubMed] [Google Scholar]
- Bedding, T. R., Mosser, B., Huber, D., et al. 2011, Nature, 471, 608 [NASA ADS] [CrossRef] [PubMed] [Google Scholar]
- Breger, M., Stich, J., Garrido, R., et al. 1993, A&A, 271, 482 [NASA ADS] [Google Scholar]
- Buzasi, D. L., Bruntt, H., Bedding, T. R., et al. 2005, ApJ, 619, 1072 [NASA ADS] [CrossRef] [Google Scholar]
- Catanzaro, G., Ripepi, V., Bernabei, S., et al. 2011, MNRAS, 411, 1167 [NASA ADS] [CrossRef] [Google Scholar]
- Chaplin, W. J., Kjeldsen, H., Christensen-Dalsgaard, J., et al. 2011, Science, 332, 213 [NASA ADS] [CrossRef] [PubMed] [Google Scholar]
- De Cat, P., & Aerts, C. 2002, A&A, 393, 965 [NASA ADS] [CrossRef] [EDP Sciences] [Google Scholar]
- Donati, J.-F., Semel, M., Carter, B. D., Rees, D. E., & Collier Cameron, A. 1997, MNRAS, 291, 658 [NASA ADS] [CrossRef] [MathSciNet] [Google Scholar]
- Fehrenbach, Ch., Duflot, M., Mannone, et al. 1997, A&ASS, 124, 255 [NASA ADS] [CrossRef] [EDP Sciences] [Google Scholar]
- Fekel, F. C., Warner, P. B., & Kaye, A. B. 2003, AJ, 125, 2196 [NASA ADS] [CrossRef] [Google Scholar]
- Gilliland, R. L., Brown, T. M., Christensen-Dalsgaard, J., et al. 2010, PASP, 122, 131 [NASA ADS] [CrossRef] [Google Scholar]
- Grigahcène, A., Antoci, V., Balona, L., et al. 2010, ApJ, 713, L192 [NASA ADS] [CrossRef] [Google Scholar]
- Henry, G. W., Fekel, F. M., & Henry, S. M. 2007, AJ, 133, 1421 [NASA ADS] [CrossRef] [Google Scholar]
- Jenkins, J. M., Caldwell, D. A., Chandrasekaran, H., et al. 2010, ApJ, 713, 87 [Google Scholar]
- Lehmann, H., Tsymbal, V., Mkrtichian, D. E., & Fraga, L. 2006, A&A, 457, 1033 [NASA ADS] [CrossRef] [EDP Sciences] [Google Scholar]
- Lehmann, H., Tkachenko, A., Semaan, T., et al. 2011, A&A, 526, A124 [NASA ADS] [CrossRef] [EDP Sciences] [Google Scholar]
- Lenz, P., & Breger, M. 2005, Commun. Asteros., 146, 53 [Google Scholar]
- Loumos, G. L., & Deeming, T. J. 1978, Ap&SS, 56, 285 [NASA ADS] [CrossRef] [EDP Sciences] [Google Scholar]
- McLauglin, D. B. 1924, ApJ, 60, 22 [NASA ADS] [CrossRef] [Google Scholar]
- Ohishi, N., Nordgren, T. E., & Hutter, D. J. 2004, ApJ, 612, 463 [CrossRef] [Google Scholar]
- Peterson, D. M., Hummel, C. A., Pauls, T. A. et al. 2006, ApJ, 636, 1087 [NASA ADS] [CrossRef] [Google Scholar]
- Preston, G. W., & Landolt, A. U. 1999, AJ, 118, 3006 [NASA ADS] [CrossRef] [Google Scholar]
- Raskin, G., Van Winckel, H., Hensberge, H., et al. 2011, A&A, 526, A69 [NASA ADS] [CrossRef] [EDP Sciences] [Google Scholar]
- Robrade, J., & Schmitt, J. H. M. M. 2009, A&A, 497, 511 [NASA ADS] [CrossRef] [EDP Sciences] [Google Scholar]
- Robrade, J., & Schmitt, J. H. M. M. 2010, A&A, 516, A38 [NASA ADS] [CrossRef] [EDP Sciences] [Google Scholar]
- Rossiter, R. A. 1924, ApJ, 69, 15 [NASA ADS] [CrossRef] [Google Scholar]
- Schmidt-Kaler, Th. 1982, in Landolt-Börnstein, eds. K. Schaifers, & H. H. Voigt (Springer-Verlag), Vol. 2b [Google Scholar]
- Shulyak, D., Tsymbal, V., Ryabchikova, T., et al. 2004, A&A, 428, 993 [NASA ADS] [CrossRef] [EDP Sciences] [Google Scholar]
- Simon, N. R., & Teays, T. J. 1982, ApJ, 261, 586 [NASA ADS] [CrossRef] [Google Scholar]
- Tkachenko, A., Lehmann, H., Smalley, B., Debosscher, J., & Aerts, C. 2012, MNRAS, 422, 2960 [NASA ADS] [CrossRef] [Google Scholar]
- Tsymbal, V. 1996, ASPC 108, 198 [Google Scholar]
- Uytterhoeven, K., & WG#10, KASC 2011a [arXiv:1111.1667] [Google Scholar]
- Uytterhoeven, K., Moya, A., Grigahcène, A., et al. 2011b, A&A, 543, A125 [NASA ADS] [CrossRef] [EDP Sciences] [Google Scholar]
All Tables
Fundamental parameters and the 1-σ formal errors as derived from the mean spectrum.
Results of the analysis of four individual spectra of KIC 5988140 taken at four different phases of the period P2.
All Figures
|
Fig. 1 Fit of the observed spectrum of KIC 5988140 (black) in two different wavelength regions assuming Teff = 7600/7400 K, log g = 3.4/3.5 and [M/H] = –0.3/–0.5 dex (resp. dashed red and dotted green lines). A colour plot is provided in the online version. |
| In the text | |
|
Fig. 2 Successive periodograms of the ground-based RV data of KIC 5988140 (top: spectral window, bottom: after prewhitening for F1 and F2). |
| In the text | |
|
Fig. 3 Top: RVs of KIC 5988140 folded on the period P2 ~ 2.91 d. Hermes RVs are indicated by triangles and TLS ones by open circles. Bottom: portion of the Kepler light curve illustrating the near 2-h period oscillations. The X-axis shows both BJD and phase. In both panels, phase zero refers to (B)JD 2 455 087.62. |
| In the text | |
|
Fig. 4 LSD-profiles computed based on the individual (solid) and mean (dashed) spectra. |
| In the text | |
|
Fig. 5 Part of the Q6-quarter of the Kepler light curve of KIC 5988140 (top) and amplitude spectrum of the entire Q6-quarter data string (bottom). |
| In the text | |
|
Fig. 6 “Basic” light curve of KIC 5988140 based on all the data and folded on the period P2 (after prewhitening for 23 frequencies). |
| In the text | |
|
Fig. 7 Temporal evolution of the (relative) amplitudes A1 and R21, R31 of the “basic” light curve of KIC 5988140. |
| In the text | |
|
Fig. 8 Residual light curve of KIC 5988140 based on all the data (after prewhitening for 28 frequencies). |
| In the text | |
|
Fig. 9 Spot models A (left) and B (right) shown for a certain rotation phase and drawn on separate greyscales to cover the full brightness range of both cases. |
| In the text | |
|
Fig. 10 RV and relative intensity variations for spot models A (solid) and B (dashed). |
| In the text | |
Current usage metrics show cumulative count of Article Views (full-text article views including HTML views, PDF and ePub downloads, according to the available data) and Abstracts Views on Vision4Press platform.
Data correspond to usage on the plateform after 2015. The current usage metrics is available 48-96 hours after online publication and is updated daily on week days.
Initial download of the metrics may take a while.