Free Access
Fig. 8
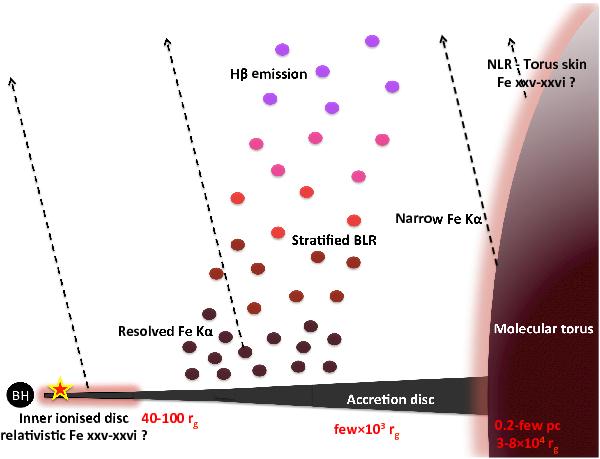
Sketch of possible locations for the different regions producing Fe K emission (diagram not to scale). The star represents the primary X-ray source, located close to the BH.
Current usage metrics show cumulative count of Article Views (full-text article views including HTML views, PDF and ePub downloads, according to the available data) and Abstracts Views on Vision4Press platform.
Data correspond to usage on the plateform after 2015. The current usage metrics is available 48-96 hours after online publication and is updated daily on week days.
Initial download of the metrics may take a while.