Fig. 5
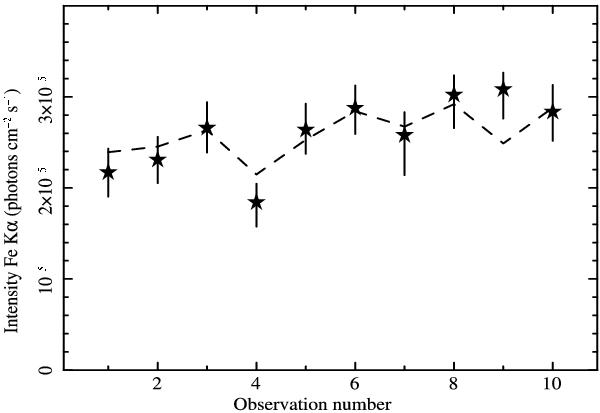
Intensity vs. observation number of the 10 XMM-Newton pointings of the 2009 campaign. The black dashed line shows the rescaled (with the mean 3–10 keV flux equalling the mean line intensity) 3 − 10 keV source flux. The intensity of the resolved component of the Fe Kα line follows, with a 1-to-1 relation the 3–10 keV continuum variations without any measurable lag. 1σ errors are shown.
Current usage metrics show cumulative count of Article Views (full-text article views including HTML views, PDF and ePub downloads, according to the available data) and Abstracts Views on Vision4Press platform.
Data correspond to usage on the plateform after 2015. The current usage metrics is available 48-96 hours after online publication and is updated daily on week days.
Initial download of the metrics may take a while.