Fig. 4
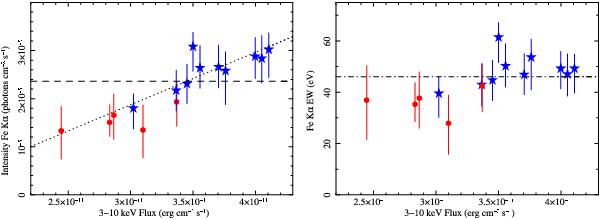
(Left and right panels) The intensity and EW of the resolved (σ = 0.22 keV) Fe Kα component (the narrow Fe Kα component is assumed to have σ = 0.027 keV and be constant) as a function of the 3–10 keV flux. Blue stars and red hexagonals show the best fit results of the 10 observations of the 2009 campaign and of the previous XMM-Newton observations, respectively. Dashed and dot dashed lines show the constant intensity and constant EW cases, respectively. The best fit relation (dotted line) is consistent with the resolved component of the Fe Kα line having constant EW. The intensity of the resolved component of the Fe Kα line follows the 3–10 keV continuum variations with a 1-to-1 relation.
Current usage metrics show cumulative count of Article Views (full-text article views including HTML views, PDF and ePub downloads, according to the available data) and Abstracts Views on Vision4Press platform.
Data correspond to usage on the plateform after 2015. The current usage metrics is available 48-96 hours after online publication and is updated daily on week days.
Initial download of the metrics may take a while.