Fig. 3
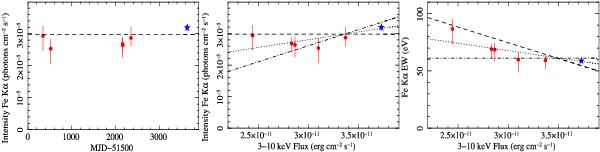
(Left, middle and right panels) Intensity vs. time in MJD, intensity vs. 3–10 keV flux and EW vs. 3–10 keV flux of the Fe Kα line fitted with a single Gaussian profile with σ = 0.092 keV (model 1), respectively. Each data point represents the best fit result obtained from the fit of the spectrum of each XMM-Newton observation (red hexagonals) and the total spectrum of the 2009 data (blue stars). The dashed lines represent the expected relations if the Fe Kα line has constant intensity, while the dash-dotted lines represent a constant EW, and the dotted line shows the best fit trend. The left panel show the observation date in Modified Julian Date, MJD minus 51 500, which corresponds to November 18, 1999. Two XMM-Newton observations occur at day 2159 and day 2163 and appear to overlap in the left panel.
Current usage metrics show cumulative count of Article Views (full-text article views including HTML views, PDF and ePub downloads, according to the available data) and Abstracts Views on Vision4Press platform.
Data correspond to usage on the plateform after 2015. The current usage metrics is available 48-96 hours after online publication and is updated daily on week days.
Initial download of the metrics may take a while.