Fig. 2
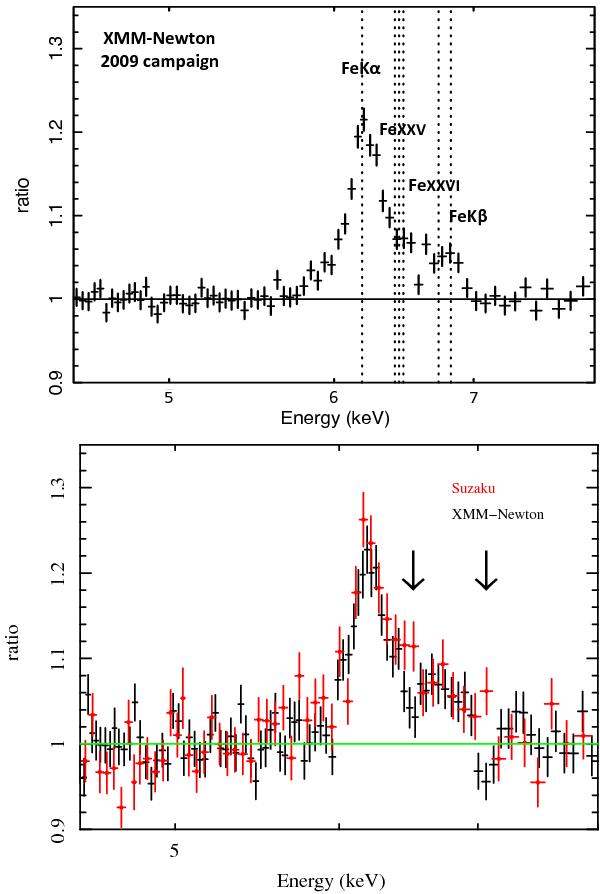
Upper panel: summed EPIC-pn spectra of the 10 observations performed during the 2009 XMM-Newton monitoring campaign. The data are fit, in the 4–5 and 7.5–10 keV bands, with a simple power law, absorbed by Galactic material, and the ratio of the data to the best-fit model is shown. The dotted lines indicate the rest frame positions of the Fe Kα, Fe Kβ, Fe xxv (resonance, intercombination and forbidden), and Fe xxvi lines. The x-axis reports the observed-frame energy. Lower panel: in red the 2006 XIS0+XIS3 Suzaku summed mean spectra are shown. In black the summed spectra of the 5 XMM-Newton observations performed between 2000 and 2006 are shown. This figure is taken from Ponti et al. (2009). The arrows mark possible absorption features in the spectrum.
Current usage metrics show cumulative count of Article Views (full-text article views including HTML views, PDF and ePub downloads, according to the available data) and Abstracts Views on Vision4Press platform.
Data correspond to usage on the plateform after 2015. The current usage metrics is available 48-96 hours after online publication and is updated daily on week days.
Initial download of the metrics may take a while.