Fig. 12
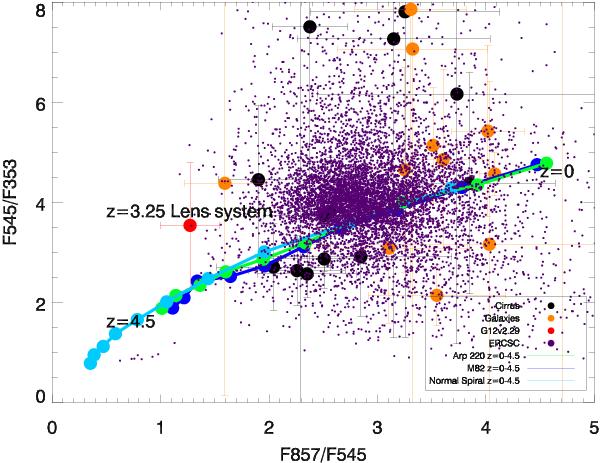
Planck colours of detected objects in the H-ATLAS phase 1 regions compared to model SED colour tracks for two star-forming and one normal spiral galaxy template. The template SEDs go from z = 0 to z = 4.5, with the dots along the lines spaced by Δz = 0.5. The large dots show the ERCSC sources within the H-ATLAS fields; the 1 sigma error bars for these sources are also included in the plot. A colour code has been assigned based on our classification using the Herschel images: orange dots correspond to sources we classify as galaxies, whereas black dots are classified as Galactic cirrus. H-ATLAS J114637.9-001132 (alias G12H29) is shown in red. For comparison, all ERCSC sources with | b | > 20° and with 3σ detections or better are also shown as purple points. Seven of the eight isolated purple points in the lower left corner of the plot correspond to blazars identified in the ERCSC (López-Caniego et al. 2012).
Current usage metrics show cumulative count of Article Views (full-text article views including HTML views, PDF and ePub downloads, according to the available data) and Abstracts Views on Vision4Press platform.
Data correspond to usage on the plateform after 2015. The current usage metrics is available 48-96 hours after online publication and is updated daily on week days.
Initial download of the metrics may take a while.