Fig. 6
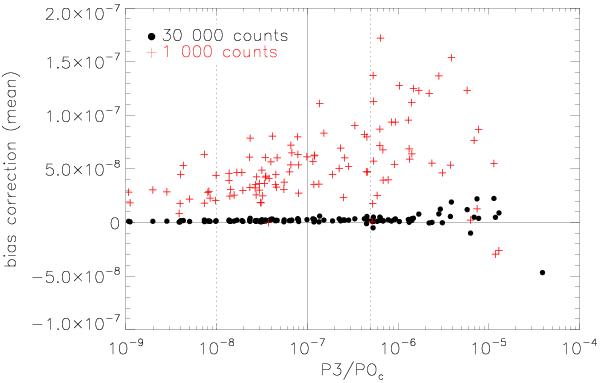
Illustration of the probability of a negative bias. We show the applied bias correction  (mean of 100 realizations) as a function of P3/P0c. The colors indicate the different counts within r500: 1000 (red crosses) and 30 000 (black circles). A negative bias correction is only needed for very structured clusters and even then it is only on the order of 1%. The solid and dotted lines show the different morphological ranges as discussed below in Sect. 5.
Current usage metrics show cumulative count of Article Views (full-text article views including HTML views, PDF and ePub downloads, according to the available data) and Abstracts Views on Vision4Press platform.
Data correspond to usage on the plateform after 2015. The current usage metrics is available 48-96 hours after online publication and is updated daily on week days.
Initial download of the metrics may take a while.