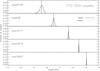
Fig. 3
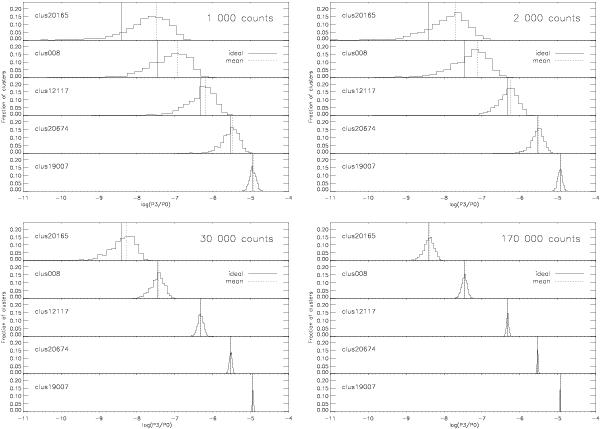
P3/P0 distribution (reflecting the bias) for different structured clusters and counts. The solid line marks the ideal P3/P0 value, the dotted line indicates the mean of 1000 realizations with noise. Details are given in Table 1. A comparison between this figure and Table 1 shows that 100 realizations are sufficient to estimate the bias.
Current usage metrics show cumulative count of Article Views (full-text article views including HTML views, PDF and ePub downloads, according to the available data) and Abstracts Views on Vision4Press platform.
Data correspond to usage on the plateform after 2015. The current usage metrics is available 48-96 hours after online publication and is updated daily on week days.
Initial download of the metrics may take a while.