Fig. .4
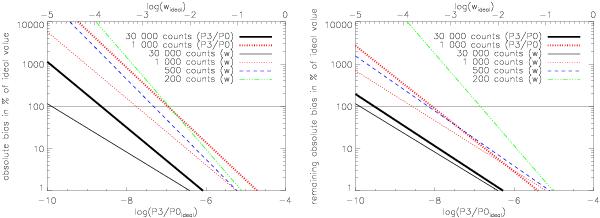
Dependence of the bias as a function of P3/P0ideal (lower axis) and wideal (upper axis). Left: absolute value of the bias before correcting. Right: absolute value of the remaining bias after applying the bias correction  and
and  . The different counts are color-coded: 30 000 black, 1000 red, 500 blue, 200 green. BP3 is shown using thick lines, Bw is represented by different thin lines. The dependencies are fits to all 121 simulated cluster images using the BCES linear regression method (Akritas & Bershady 1996).
Current usage metrics show cumulative count of Article Views (full-text article views including HTML views, PDF and ePub downloads, according to the available data) and Abstracts Views on Vision4Press platform.
Data correspond to usage on the plateform after 2015. The current usage metrics is available 48-96 hours after online publication and is updated daily on week days.
Initial download of the metrics may take a while.