Fig. 16
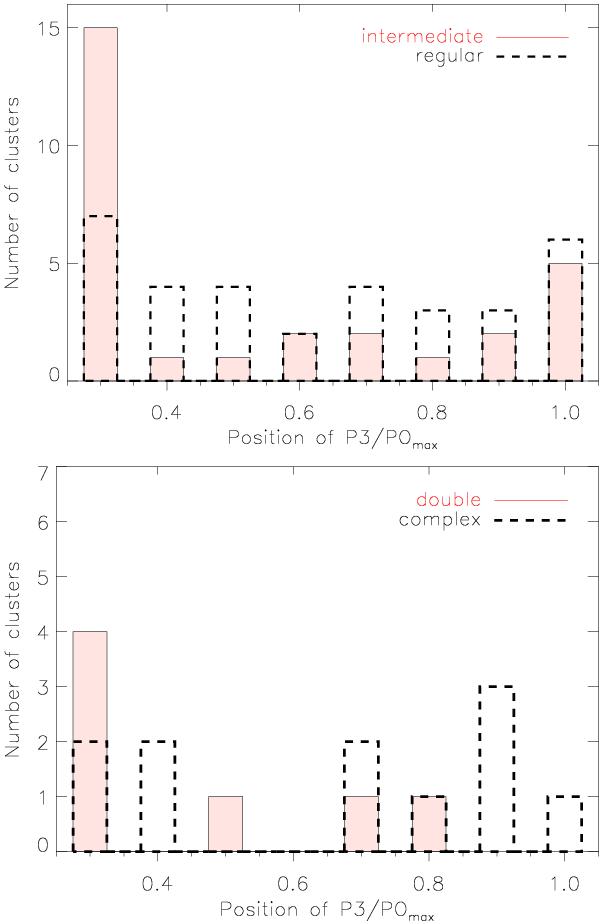
Histogram for all four morphological types showing the position of P3/P0max. Top: regular (black dashed line) and intermediate (red filled histogram) clusters are shown. There is a clear excess in the 0.3 r500 aperture. Bottom: complex (black dashed line) and double (red filled histogram) clusters are displayed. The distribution is homogeneous since the position of the peak depends on the location of the second component or structure.
Current usage metrics show cumulative count of Article Views (full-text article views including HTML views, PDF and ePub downloads, according to the available data) and Abstracts Views on Vision4Press platform.
Data correspond to usage on the plateform after 2015. The current usage metrics is available 48-96 hours after online publication and is updated daily on week days.
Initial download of the metrics may take a while.