Fig. 14
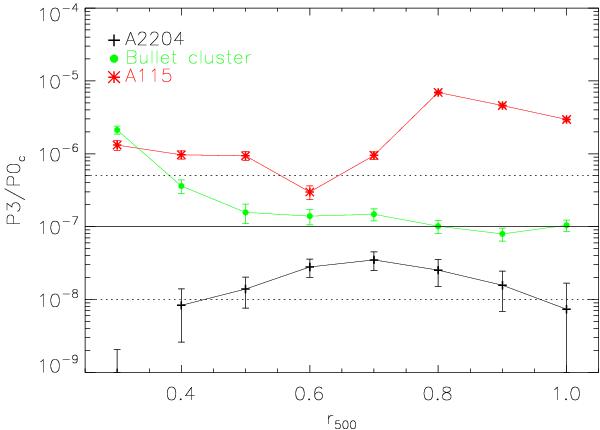
P3/P0 profile. P3/P0 calculated in 8 apertures (0.3–1 r500) is shown for 3 different clusters. The horizontal lines show the simple (solid line) and the morphological P3/P0 boundaries (dotted lines). A115 (red asterisks) shows a clear second component, which is located around 0.8 r500. In the r500 aperture it is thus classified as highly disturbed. The Bullet cluster (green circles) also clearly shows a second component, however this component lies at 0.3 r500 and thus P3/P0 becomes less important for larger apertures. A2204 (black crosses) on the other hand is a regular cluster, which does not reach a large P3/P0 value in any aperture.
Current usage metrics show cumulative count of Article Views (full-text article views including HTML views, PDF and ePub downloads, according to the available data) and Abstracts Views on Vision4Press platform.
Data correspond to usage on the plateform after 2015. The current usage metrics is available 48-96 hours after online publication and is updated daily on week days.
Initial download of the metrics may take a while.