Free Access
Fig. 11
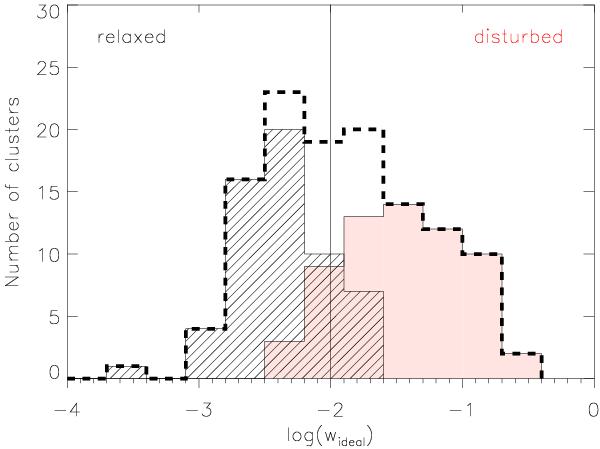
Center shift histogram of all simulated clusters (thick black dashed line) defining the wboundary. Relaxed clusters are represented by the filled black (left) and disturbed ones by the red filled histogram (right). The vertical line marks the wboundary at log (wideal) = –2.
Current usage metrics show cumulative count of Article Views (full-text article views including HTML views, PDF and ePub downloads, according to the available data) and Abstracts Views on Vision4Press platform.
Data correspond to usage on the plateform after 2015. The current usage metrics is available 48-96 hours after online publication and is updated daily on week days.
Initial download of the metrics may take a while.