Fig. 4
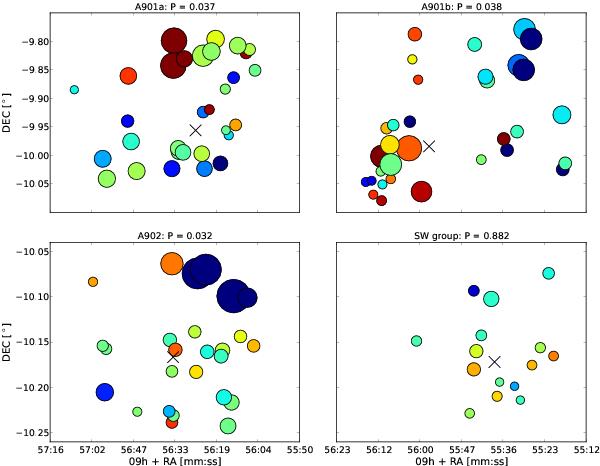
Results from the Dressler-Shectman (DS) test. The plots show the spatial location of the cluster member galaxies. The radii of the plotted circles are proportional to eδ, where δ is the DS measurement of the local deviation from the global velocity dispersion and mean recessional velocity, i.e. larger symbols correspond to a higher significance of residing in a substructure. The colours indicate the rest-frame velocity relative to the subcluster centre, ranging from red (receding; 1500 km s-1) to blue (approaching; −1500 km s-1). The black crosses indicate the subcluster centres. P is the probability of there being no substructure in the dataset. Except for the SW-group, each of the other 3 subclusters shows a high significance for substructure. The significant substructures and non-Gaussian redshift distributions indicate that the cluster system is dynamically young and not in a virialised state.
Current usage metrics show cumulative count of Article Views (full-text article views including HTML views, PDF and ePub downloads, according to the available data) and Abstracts Views on Vision4Press platform.
Data correspond to usage on the plateform after 2015. The current usage metrics is available 48-96 hours after online publication and is updated daily on week days.
Initial download of the metrics may take a while.