Fig. 18
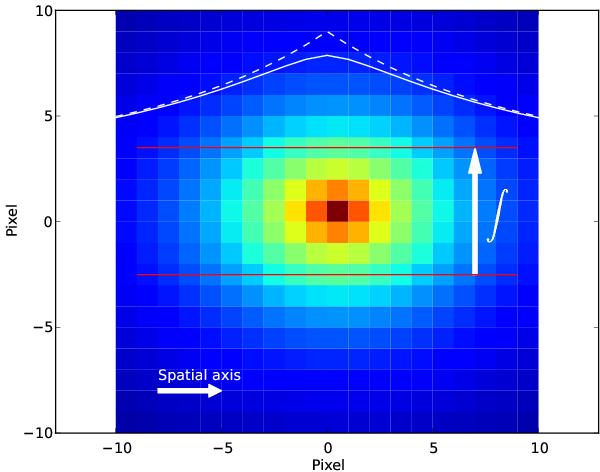
Illustration of the flux integration perpendicular to the slit direction. The exponential profile is projected due to the inclination, i, of the disk (here i = 40°). Hence, the isocontours have elliptical shapes. The galaxy and slit dimensions shown here are typical of our data. In the upper part, the integrated and PSF-convolved profiles (solid line) are compared with an exponential function (dashed line).
Current usage metrics show cumulative count of Article Views (full-text article views including HTML views, PDF and ePub downloads, according to the available data) and Abstracts Views on Vision4Press platform.
Data correspond to usage on the plateform after 2015. The current usage metrics is available 48-96 hours after online publication and is updated daily on week days.
Initial download of the metrics may take a while.