Free Access
Fig. 7
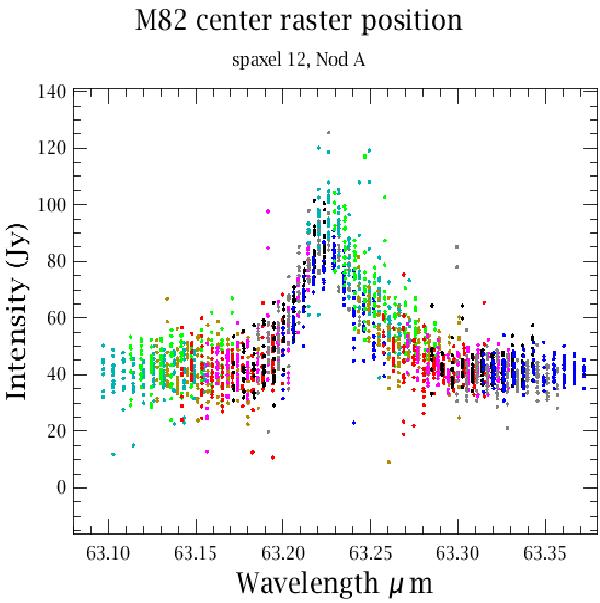
Example of bright line mode observation. The figure shows the spectrum of all spectral pixel of the central spaxel of the field of view, in different color for each spectral pixel, for Nod A. (This figure is available in color in the electronic form.)
Current usage metrics show cumulative count of Article Views (full-text article views including HTML views, PDF and ePub downloads, according to the available data) and Abstracts Views on Vision4Press platform.
Data correspond to usage on the plateform after 2015. The current usage metrics is available 48-96 hours after online publication and is updated daily on week days.
Initial download of the metrics may take a while.