Fig. 4
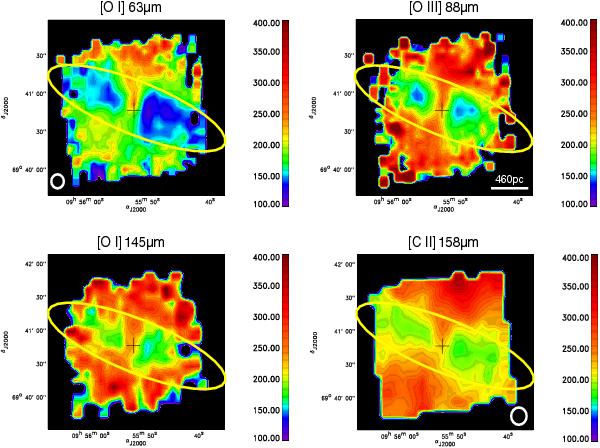
Velocity dispersion maps obtained from the fitted line widths deconvolved with the instrumental profile width, in km s-1. The black cross corresponds to the adopted center of M 82. The yellow ellipse corresponds to the stellar disk as described by the Ks-band emission shown in contours in Fig. 9. (This figure is available in color in the electronic form.)
Current usage metrics show cumulative count of Article Views (full-text article views including HTML views, PDF and ePub downloads, according to the available data) and Abstracts Views on Vision4Press platform.
Data correspond to usage on the plateform after 2015. The current usage metrics is available 48-96 hours after online publication and is updated daily on week days.
Initial download of the metrics may take a while.