Fig. 22
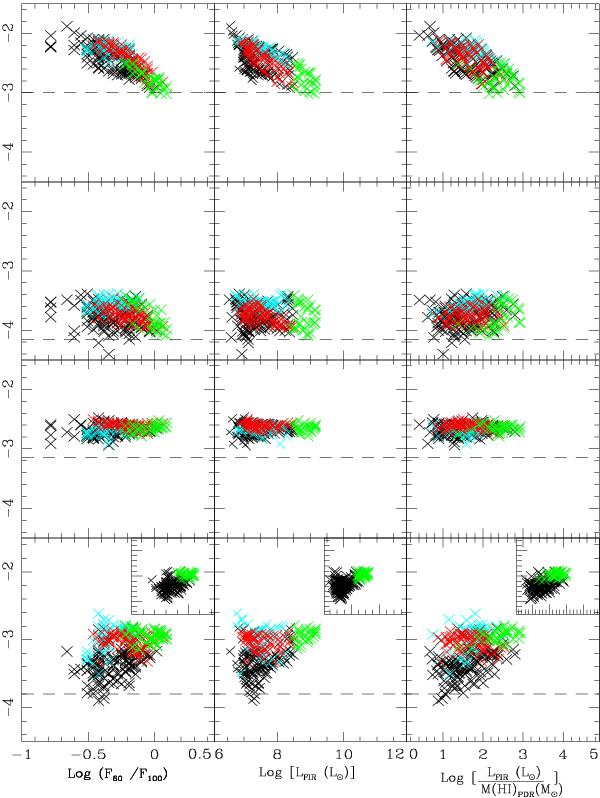
The line/FIR ratio versus: left: 60/100 colors; middle: LFIR; right: LFIR/M(HI)PDRs. Data are for M 82 only. Black points are from the diffuse disk; red points from the southern outflow; cyan points from the northern outflow and green points from the starburst. The small frames in the last row show the same relation reported in the big frames but only for the points belonging to the disk (black) and the starburst (green). The horizontal lines correspond to the threshold identified by Graciá Carpio et al. (2011) between galaxy with normal (above) and deficient (below) FIRline/FIRcontinuum ratios, or between normal and high efficency of SF. (This figure is available in color in the electronic form.)
Current usage metrics show cumulative count of Article Views (full-text article views including HTML views, PDF and ePub downloads, according to the available data) and Abstracts Views on Vision4Press platform.
Data correspond to usage on the plateform after 2015. The current usage metrics is available 48-96 hours after online publication and is updated daily on week days.
Initial download of the metrics may take a while.