Fig. 21
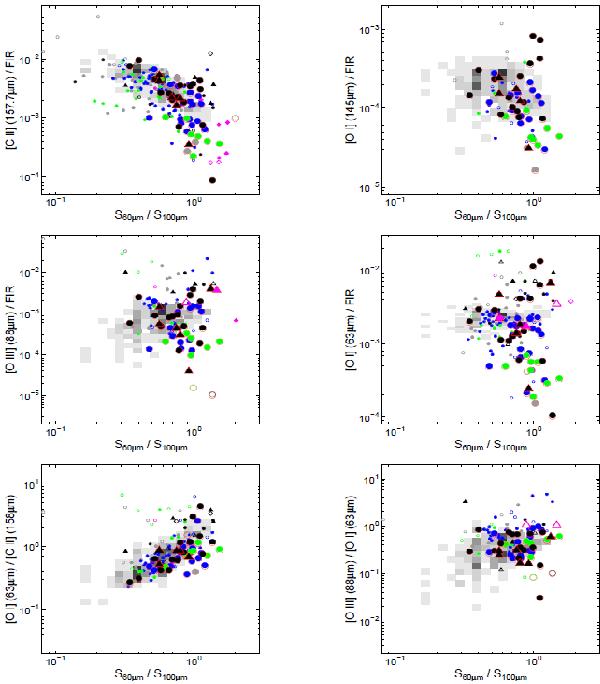
[CII]/FIR, [OI] 145 μm/FIR, [OIII]/FIR, [OI] 63 μm/FIR, [OI] 63 μm/[CII] and [OIII] 88/[OI] 63 μm versus the continuum 60/100 μm ratio. M 82 values are shown as gray scale. Symbols are the following (Graciá Carpio et al. 2011, and in prep.): big symbols: SHINING/PACS observations; filled symbols: the lines are detected; open symbols: one or both lines are not detected; blue points: HII galaxies; green points: LINER galaxies; black symbols: AGNs; circles: Seyfert 2 galaxies; triangles: Seyfert 1 galaxies; diamonds: QSOs; magenta points: high-z galaxies; grey points: unclassified galaxies; small magenta points: flux at 25 or at 100 μm is an upper limit. (This figure is available in color in the electronic form.)
Current usage metrics show cumulative count of Article Views (full-text article views including HTML views, PDF and ePub downloads, according to the available data) and Abstracts Views on Vision4Press platform.
Data correspond to usage on the plateform after 2015. The current usage metrics is available 48-96 hours after online publication and is updated daily on week days.
Initial download of the metrics may take a while.