Fig. 20
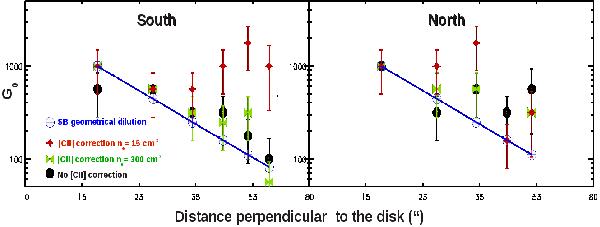
The observed FUV ISRF in Habig units along the minor axis of M 82 are plotted as a function of the distance from the galaxy center in ″, for the south (left) and north (right) outflow separately. The blue symbols connected by the blue line, are the values calculated in the pure geometrical dilution hypothesis. The starburst region, which occupies the central 250 pc (~15″) is not included. (This figure is available in color in the electronic form.)
Current usage metrics show cumulative count of Article Views (full-text article views including HTML views, PDF and ePub downloads, according to the available data) and Abstracts Views on Vision4Press platform.
Data correspond to usage on the plateform after 2015. The current usage metrics is available 48-96 hours after online publication and is updated daily on week days.
Initial download of the metrics may take a while.