Fig. 18
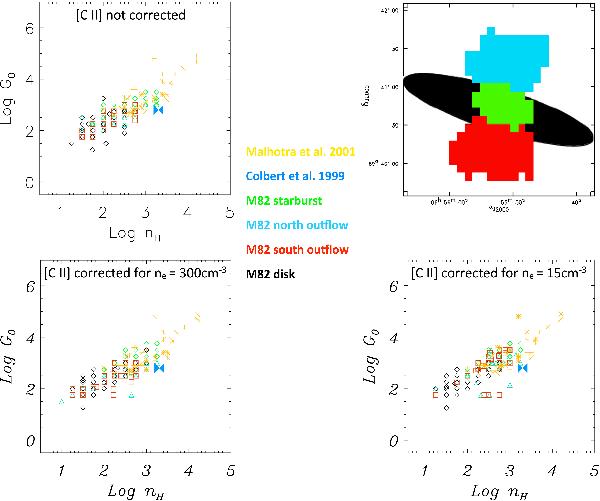
PDR solutions for M 82 obtained by using [CII], [OI] at 145 μm and TIR as input parameters to the model. On the right of the top panel a schematic view of the masks used to define the starburst (green), the disk (black), and the north (cyan) and south (red) outflow is shown. The same color code has been used for the plotting. Also overplotted for comparison, the solutions obtained for a local sample of normal star forming galaxies from Malhotra et al. (2001) (yellow stars) and with the ISO-LWS single pointing flux of M 82 (Colbert et al. 1999). Top: PDR solutions obtained by using as input the [CII] emission not corrected for the ionized gas contribution. Bottom left: the results obtained by using the [CII] corrected for the ionized gas contribution assuming a electron density equal to 300 cm-3. Bottom right: the results obtained by using the [CII] corrected for the ionized gas contribution assuming a electron density equal to 15 cm-3. See Sect. 4.1.3 for details. (This figure is available in color in the electronic form.)
Current usage metrics show cumulative count of Article Views (full-text article views including HTML views, PDF and ePub downloads, according to the available data) and Abstracts Views on Vision4Press platform.
Data correspond to usage on the plateform after 2015. The current usage metrics is available 48-96 hours after online publication and is updated daily on week days.
Initial download of the metrics may take a while.