Fig. 13
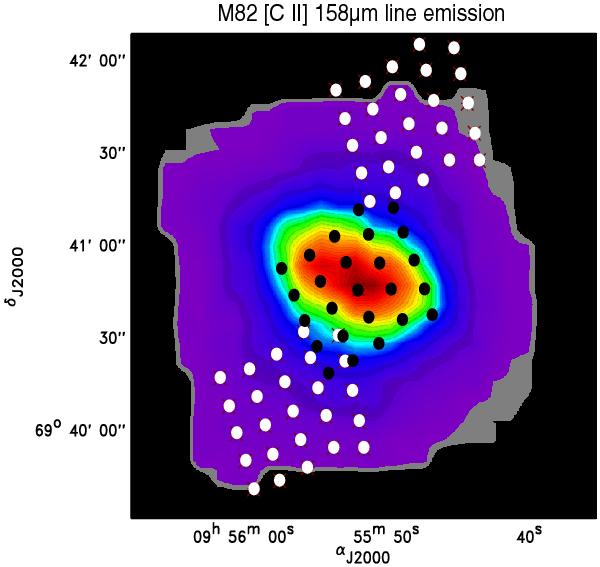
The PACS spectrometer footprints of the 3 pointings executed in [NII] 122 μm are overplotted on the [CII] intensity map of M 82 (the same as shown in Fig. 2). Note that the size of the circles does not represent the size of a spaxel on the sky. (This figure is available in color in the electronic form.)
Current usage metrics show cumulative count of Article Views (full-text article views including HTML views, PDF and ePub downloads, according to the available data) and Abstracts Views on Vision4Press platform.
Data correspond to usage on the plateform after 2015. The current usage metrics is available 48-96 hours after online publication and is updated daily on week days.
Initial download of the metrics may take a while.