Free Access
Fig. 1
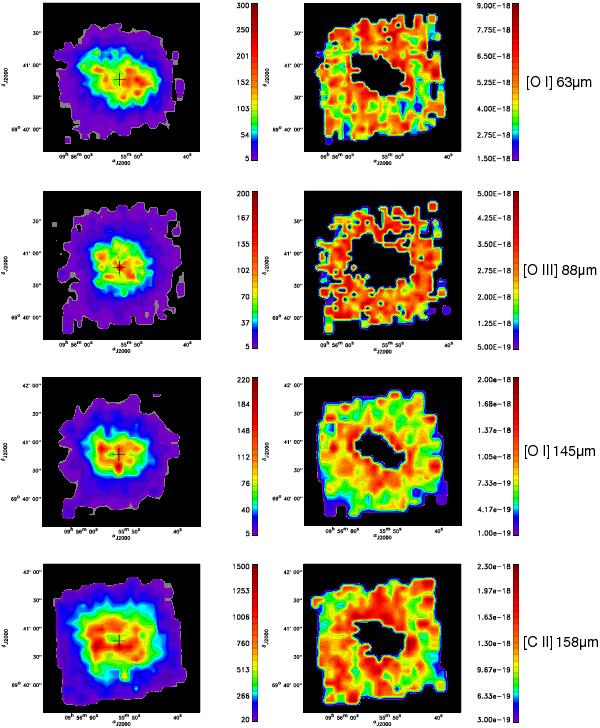
Left column: for each line the signal to noise ratios maps. Right column: for each line the “error” maps in W m-2, obtained as explained in Sect. 2 with the central region masked. (This figure is available in color in the electronic form.)
Current usage metrics show cumulative count of Article Views (full-text article views including HTML views, PDF and ePub downloads, according to the available data) and Abstracts Views on Vision4Press platform.
Data correspond to usage on the plateform after 2015. The current usage metrics is available 48-96 hours after online publication and is updated daily on week days.
Initial download of the metrics may take a while.