Fig. 25
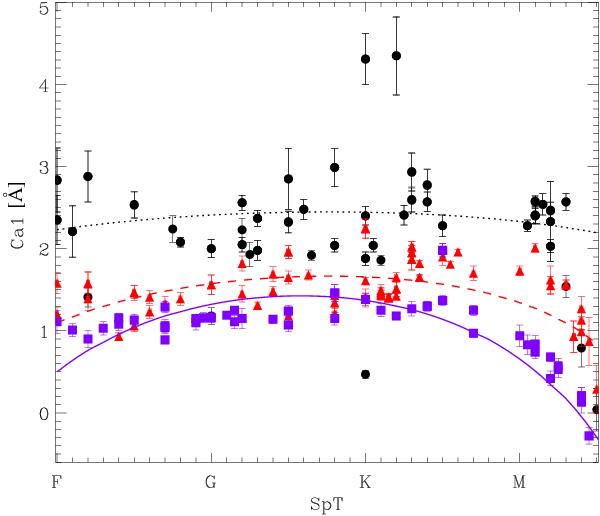
Equivalent width of the Ca1 index as a function of spectral type for the observed and model spectrum of the sample stars. The different symbols correspond to the measurements in the observed spectra of the supergiant (circles), giant (triangles), and dwarf stars (squares), respectively. The different lines are for measurements in the model spectrum of of the supergiant (dotted line), giant (dashed line), and dwarf stars (solid line), respectively.
Current usage metrics show cumulative count of Article Views (full-text article views including HTML views, PDF and ePub downloads, according to the available data) and Abstracts Views on Vision4Press platform.
Data correspond to usage on the plateform after 2015. The current usage metrics is available 48-96 hours after online publication and is updated daily on week days.
Initial download of the metrics may take a while.